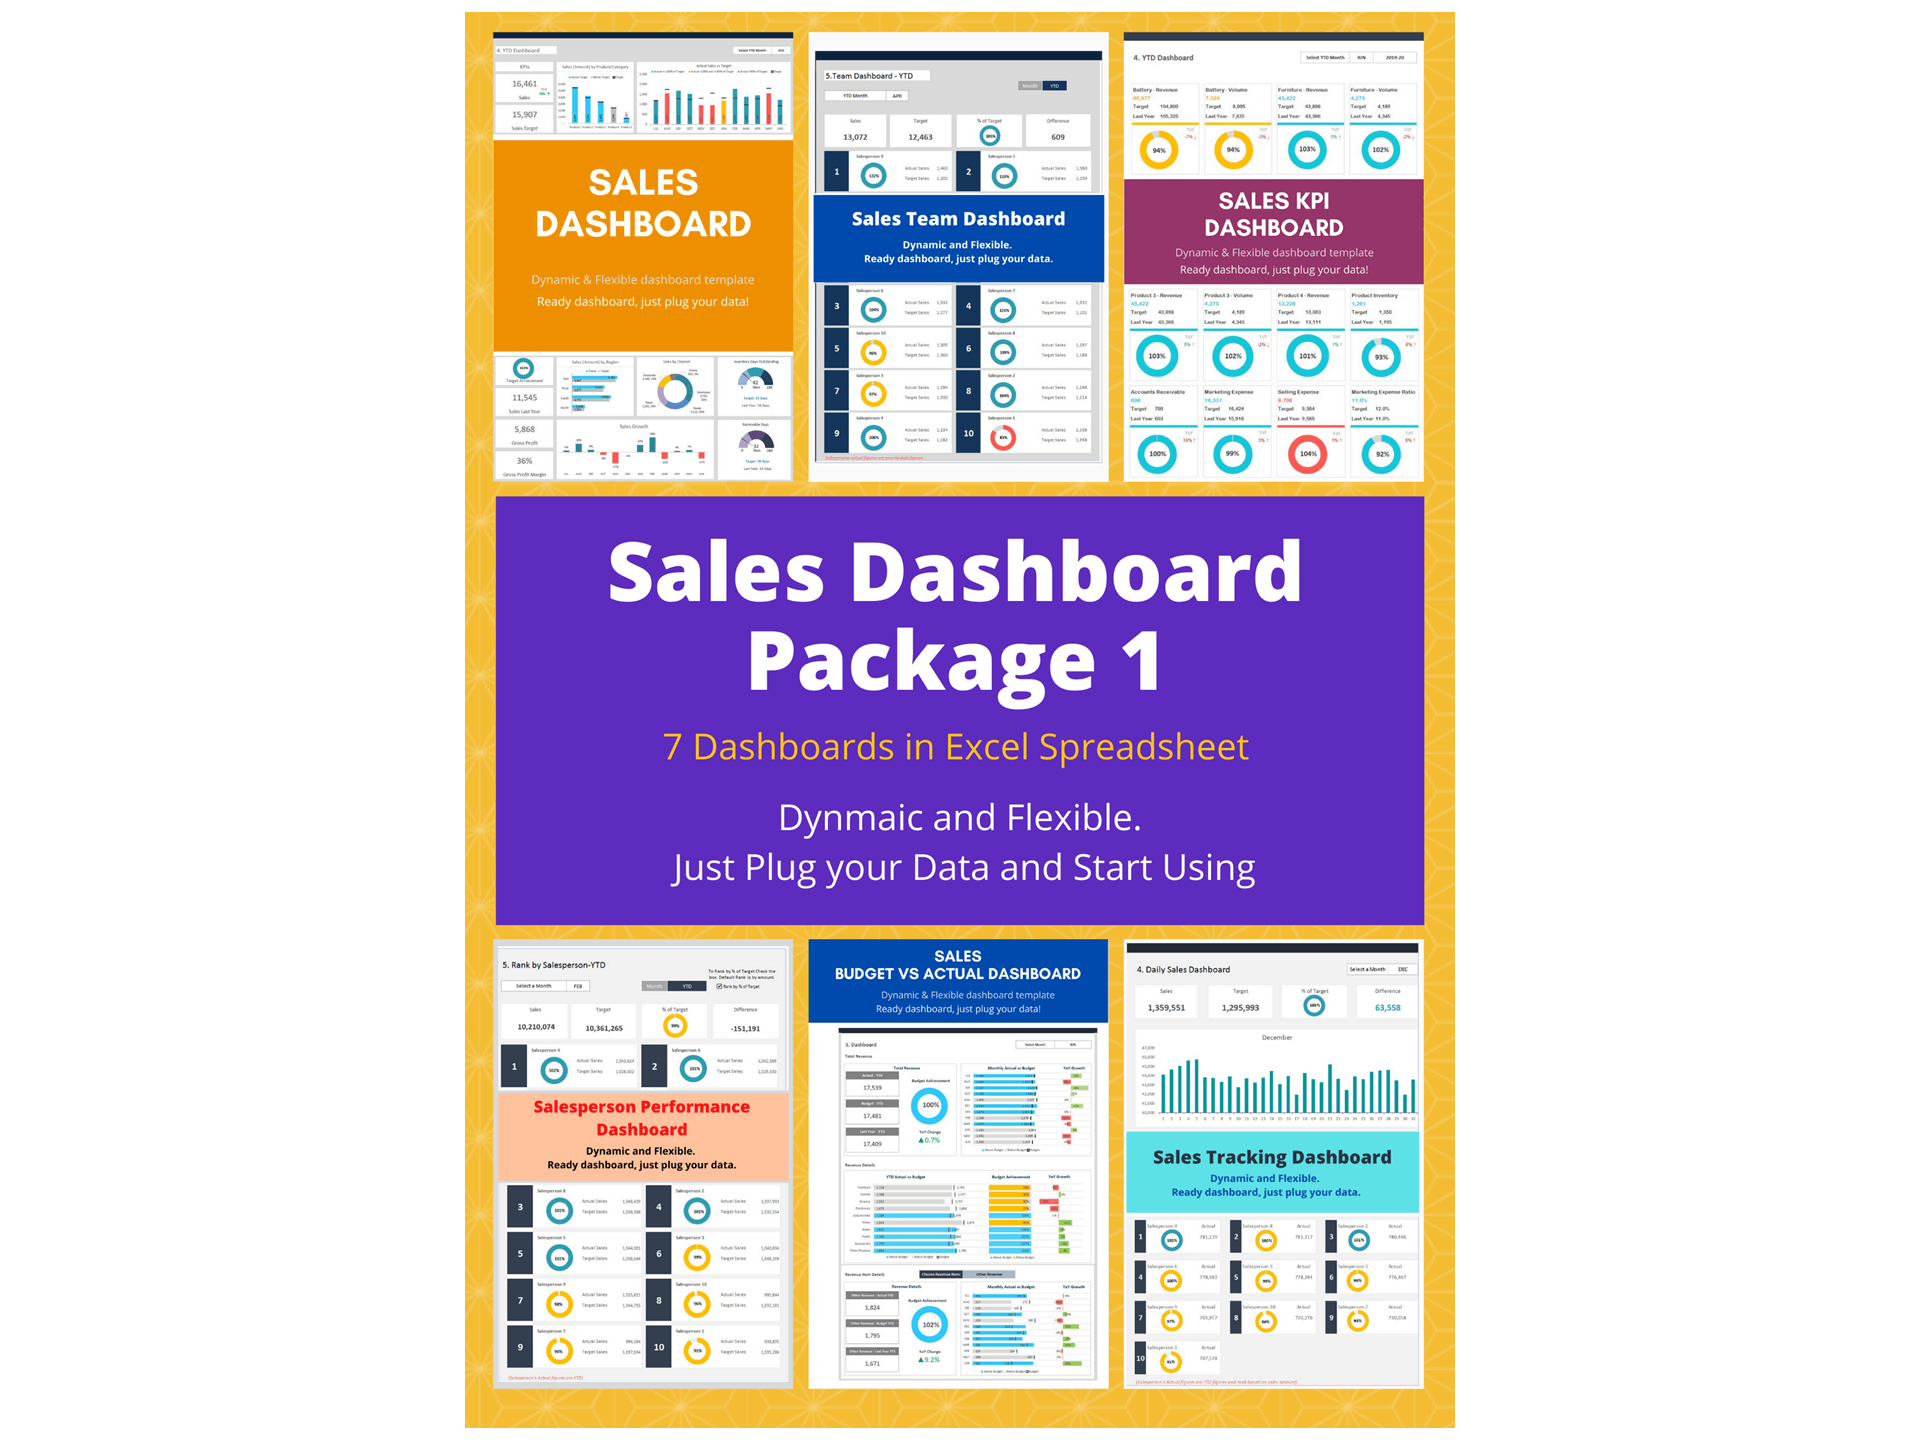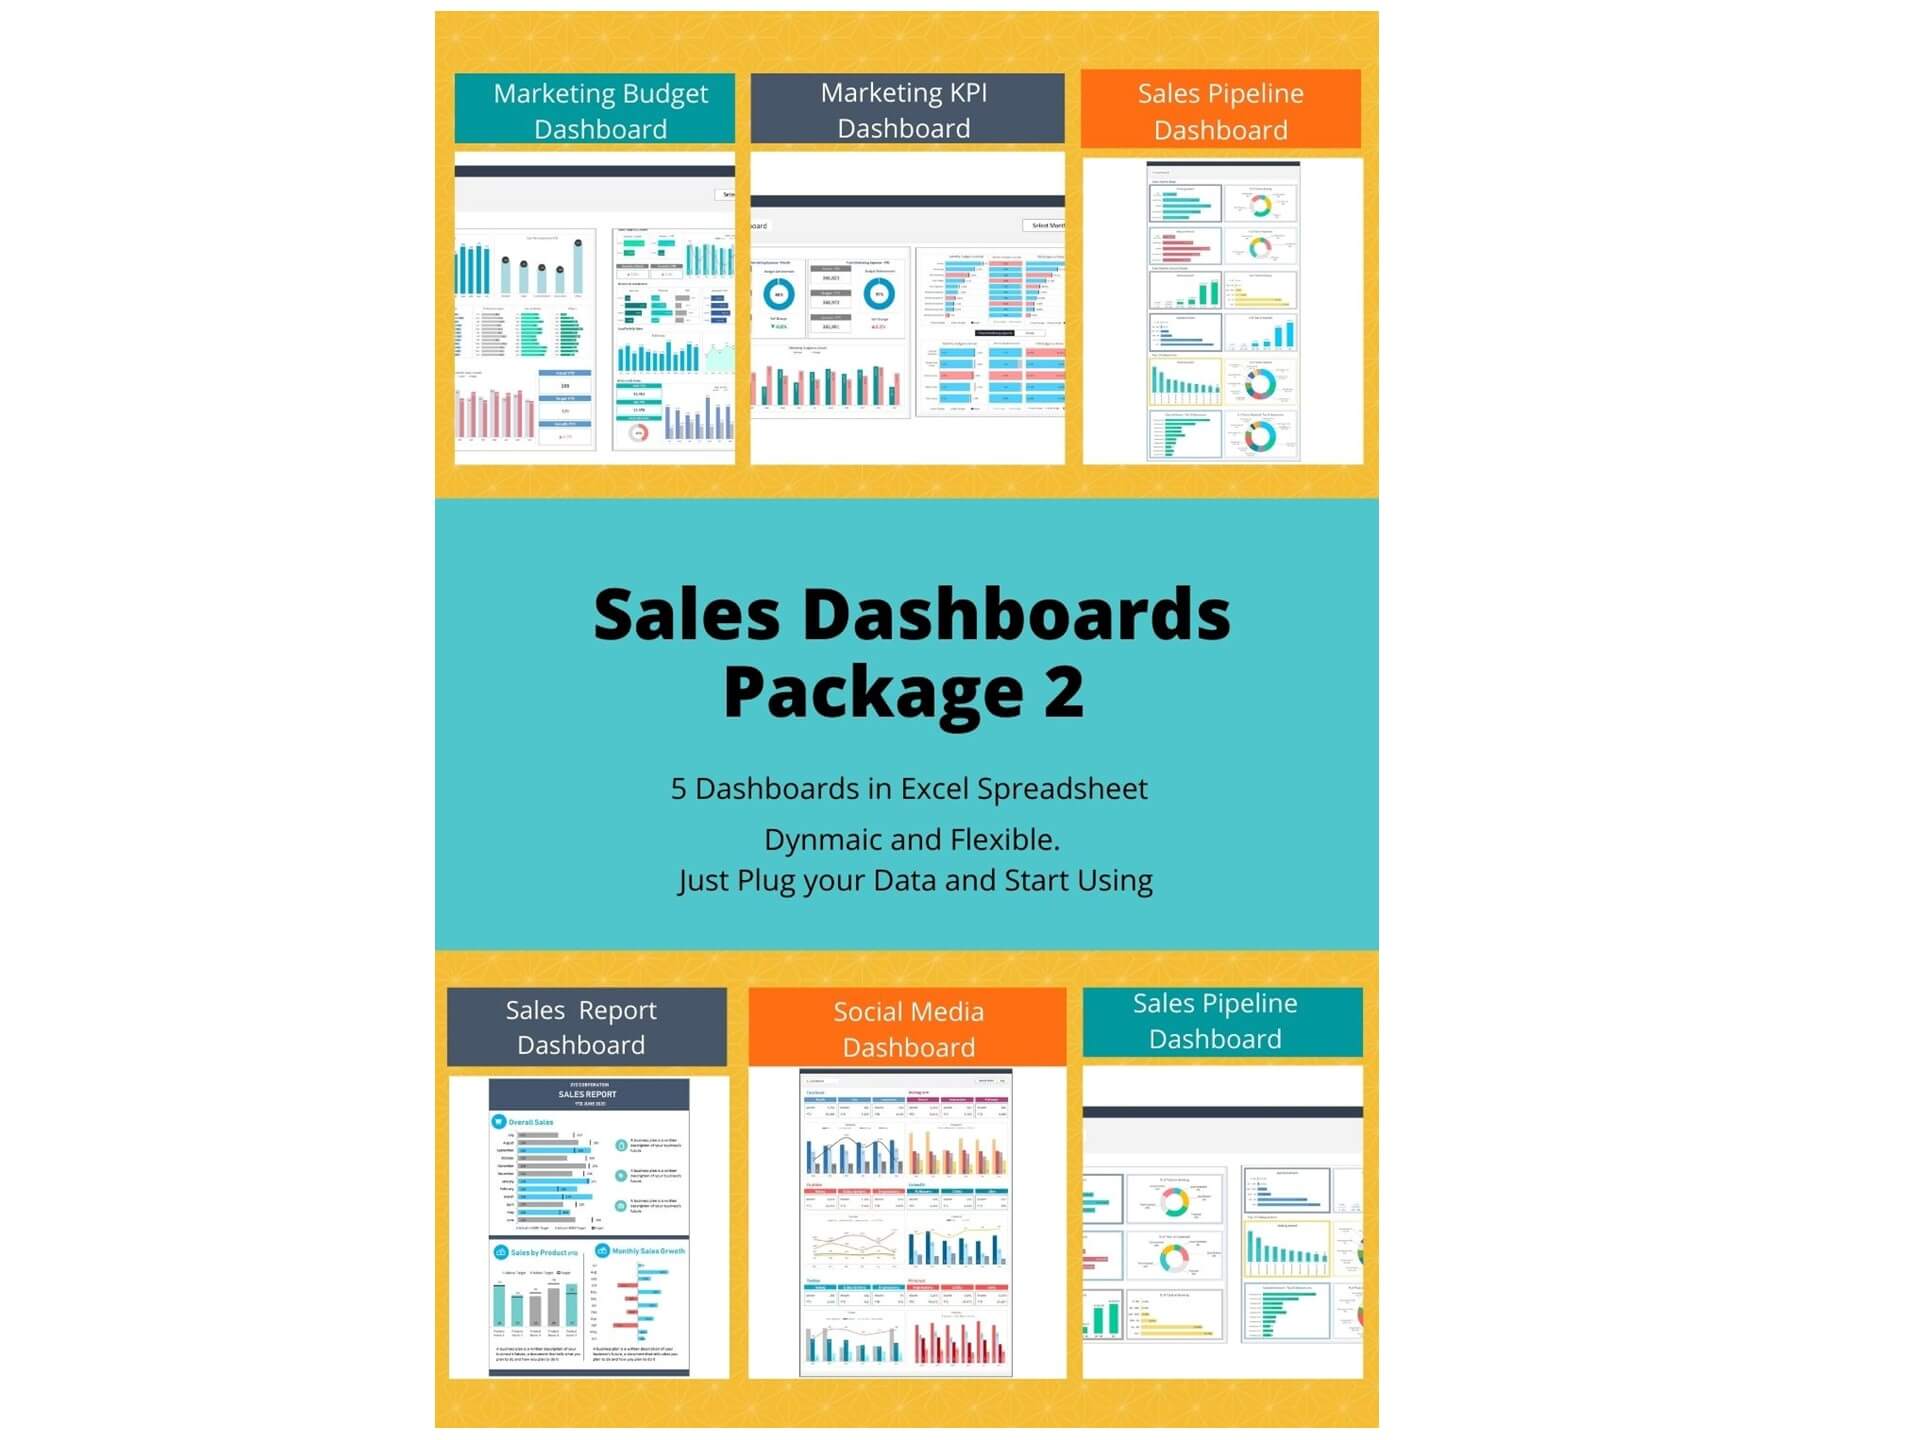
Salesperson Performance Dashboard is an Excel Template that will help to manage your sales team as a whole and by an individual salesperson. This template is designed to see your overall sales summary and ranking by an individual salesperson.
Salesperson Performance Dashboard Template depicts a visual representation of sales results in order to boost performance, create accountability and monitor progresses. The data-driven process assists to make judicious decisions. The sales tracking dashboard template helps to measure key metrics, individual team members, and the total sales team as a whole.
Key Features of Dashboard Template:
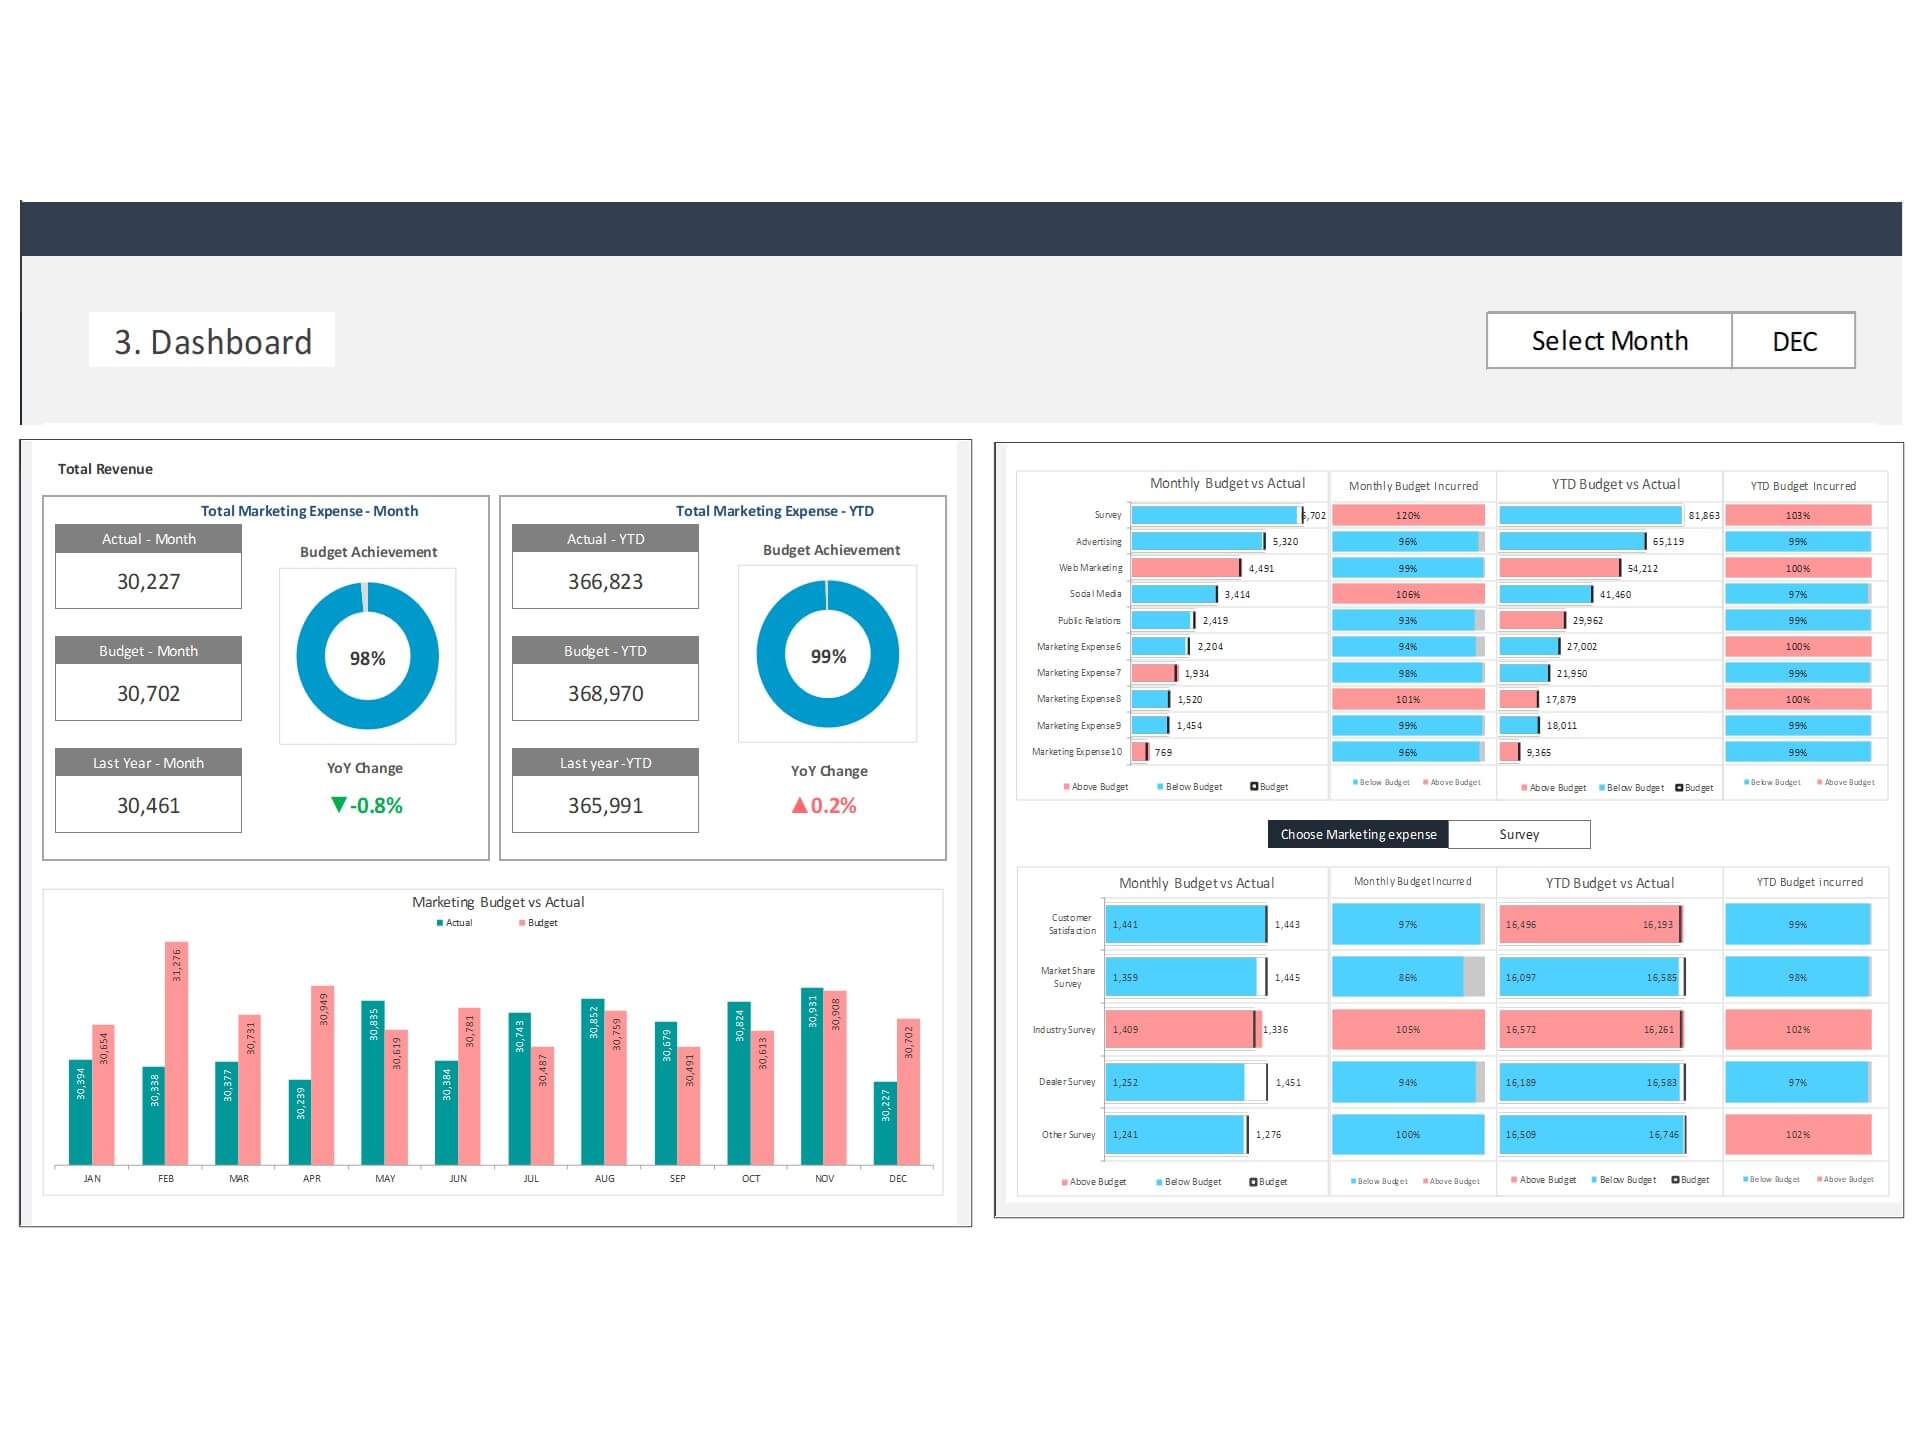
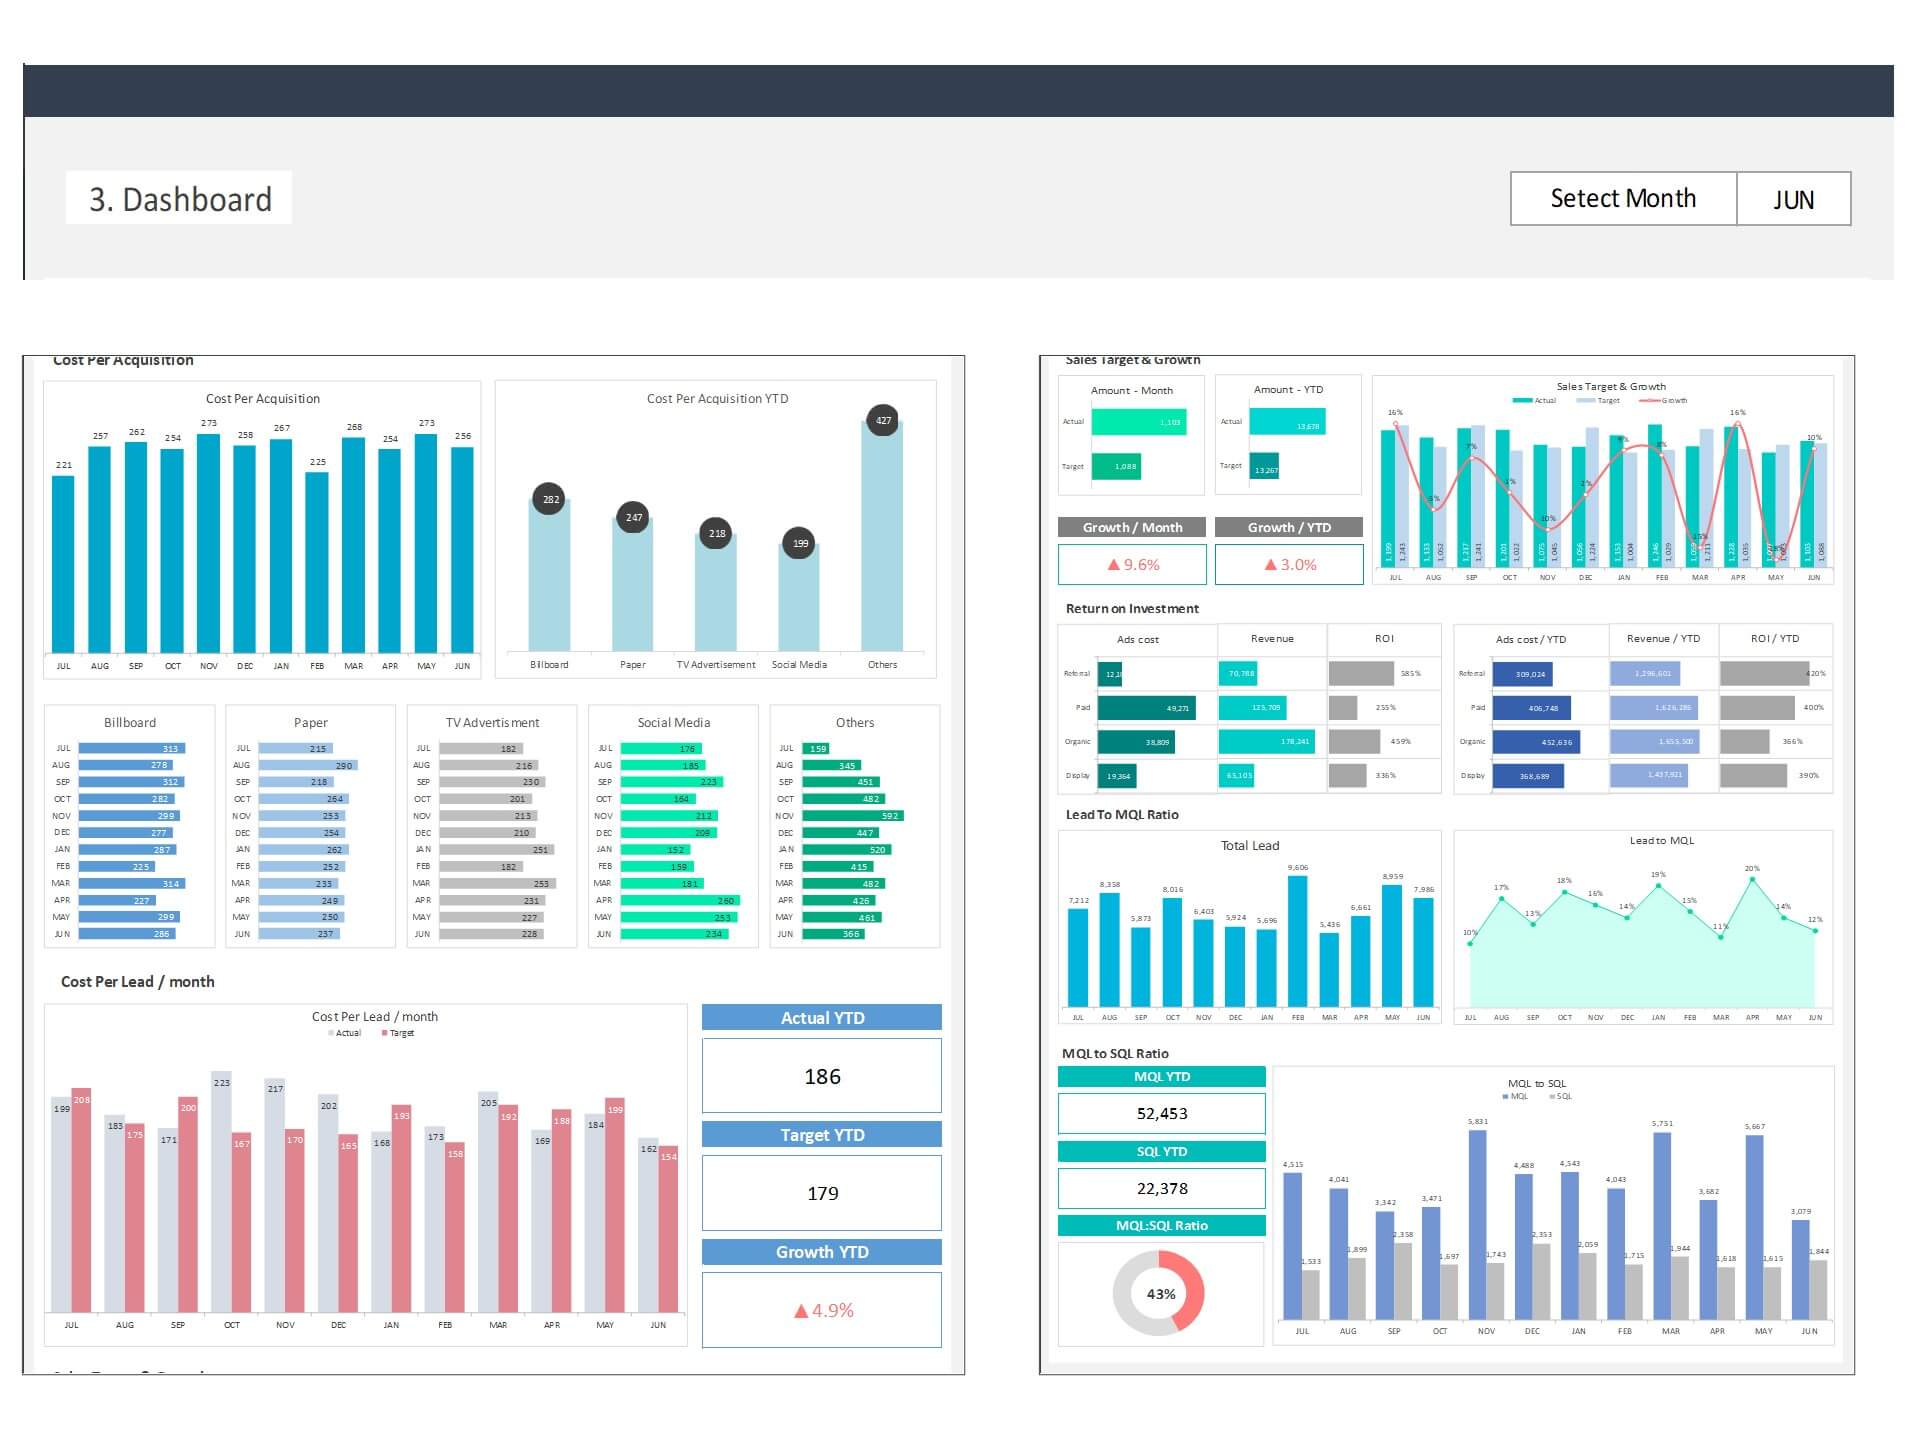
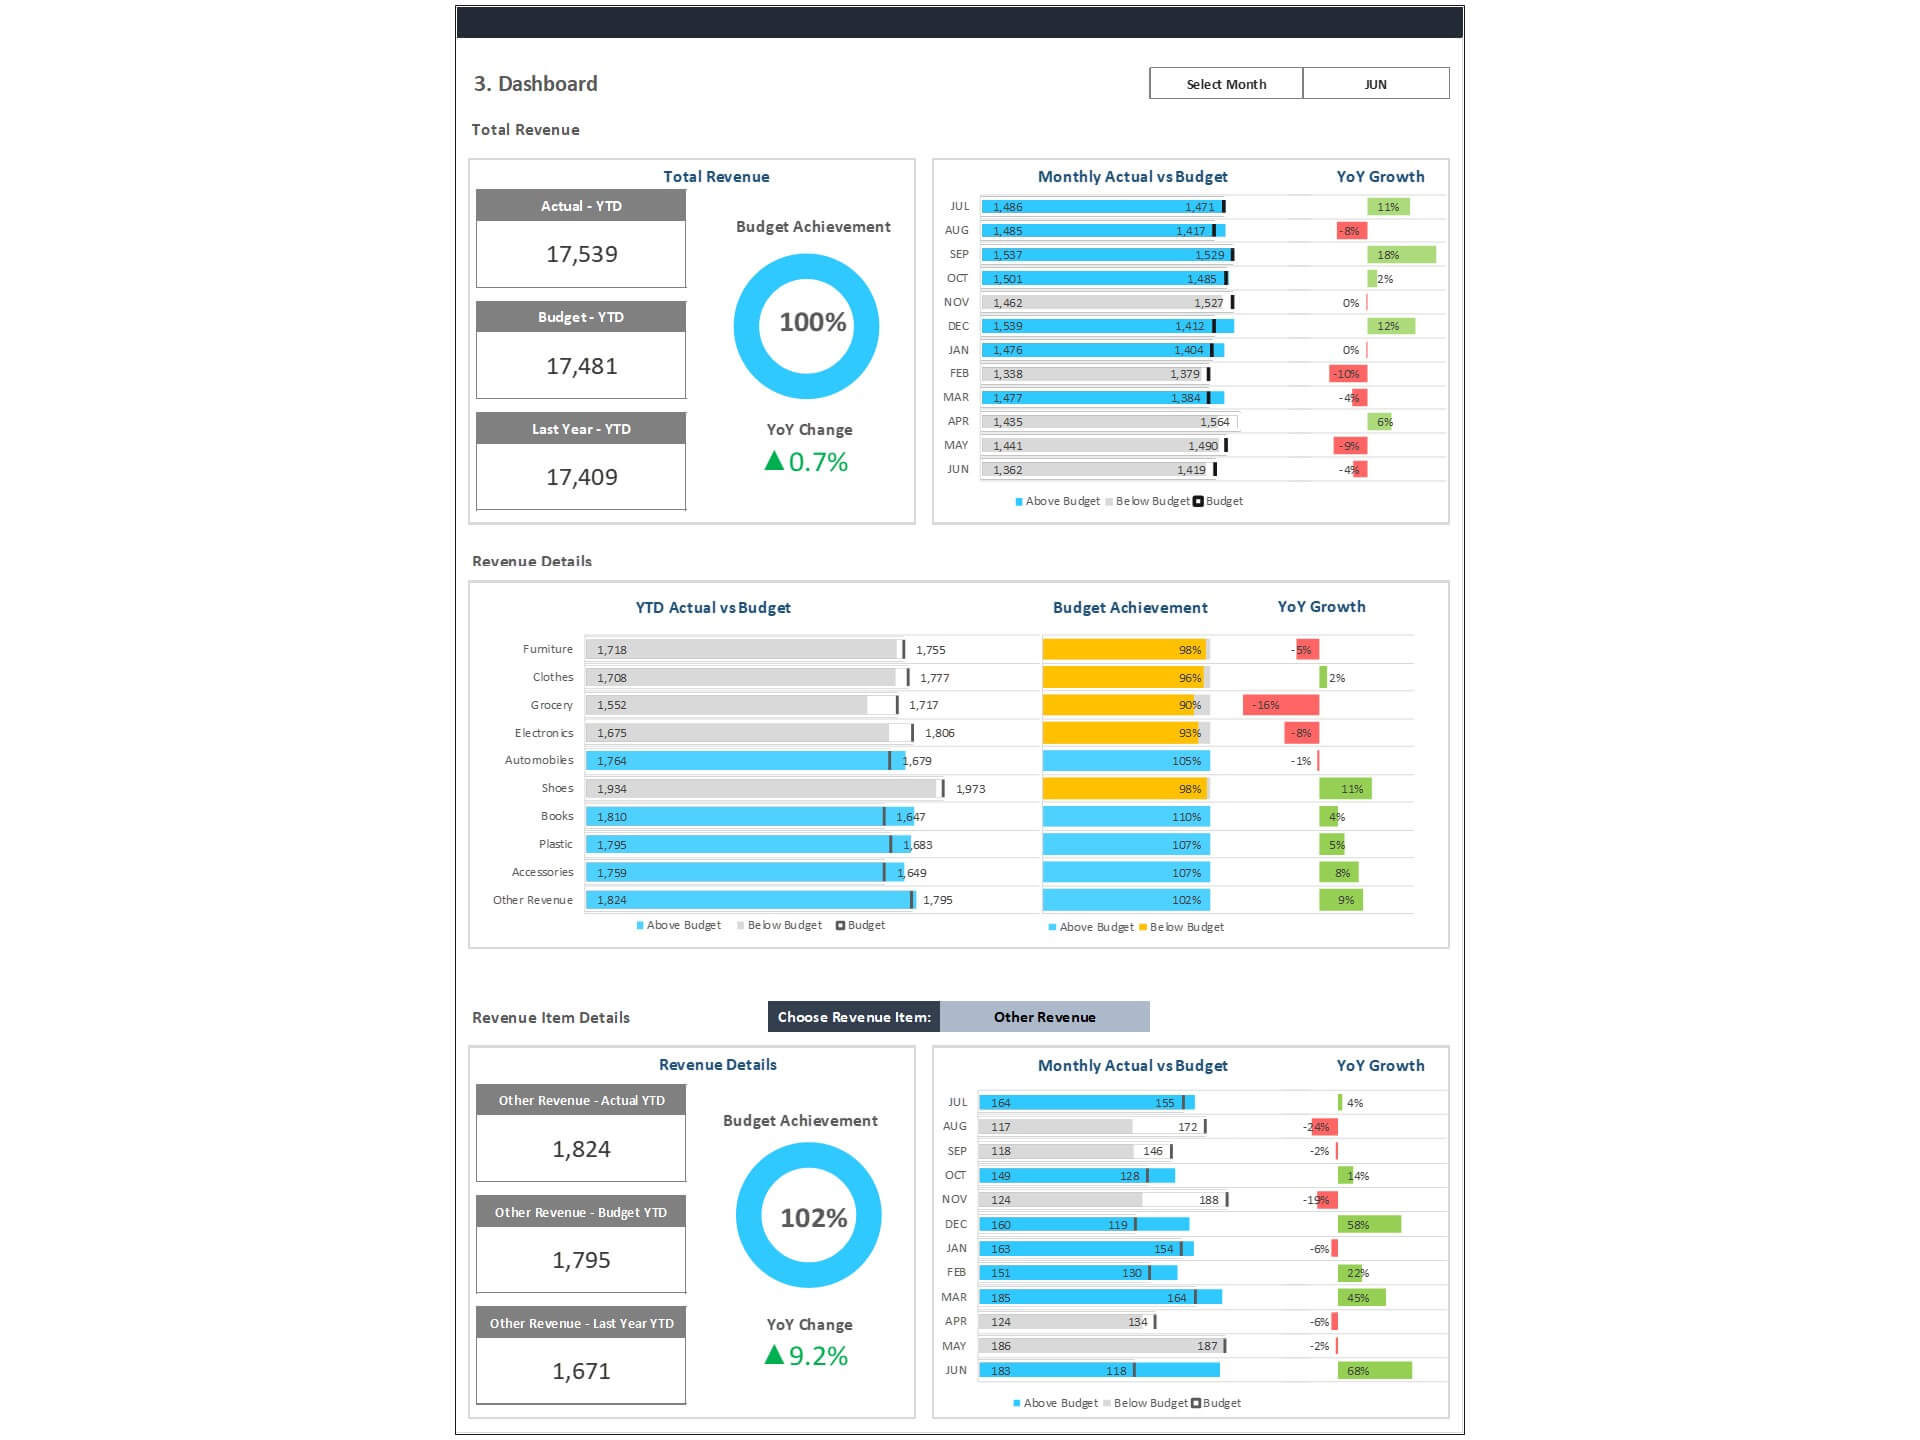
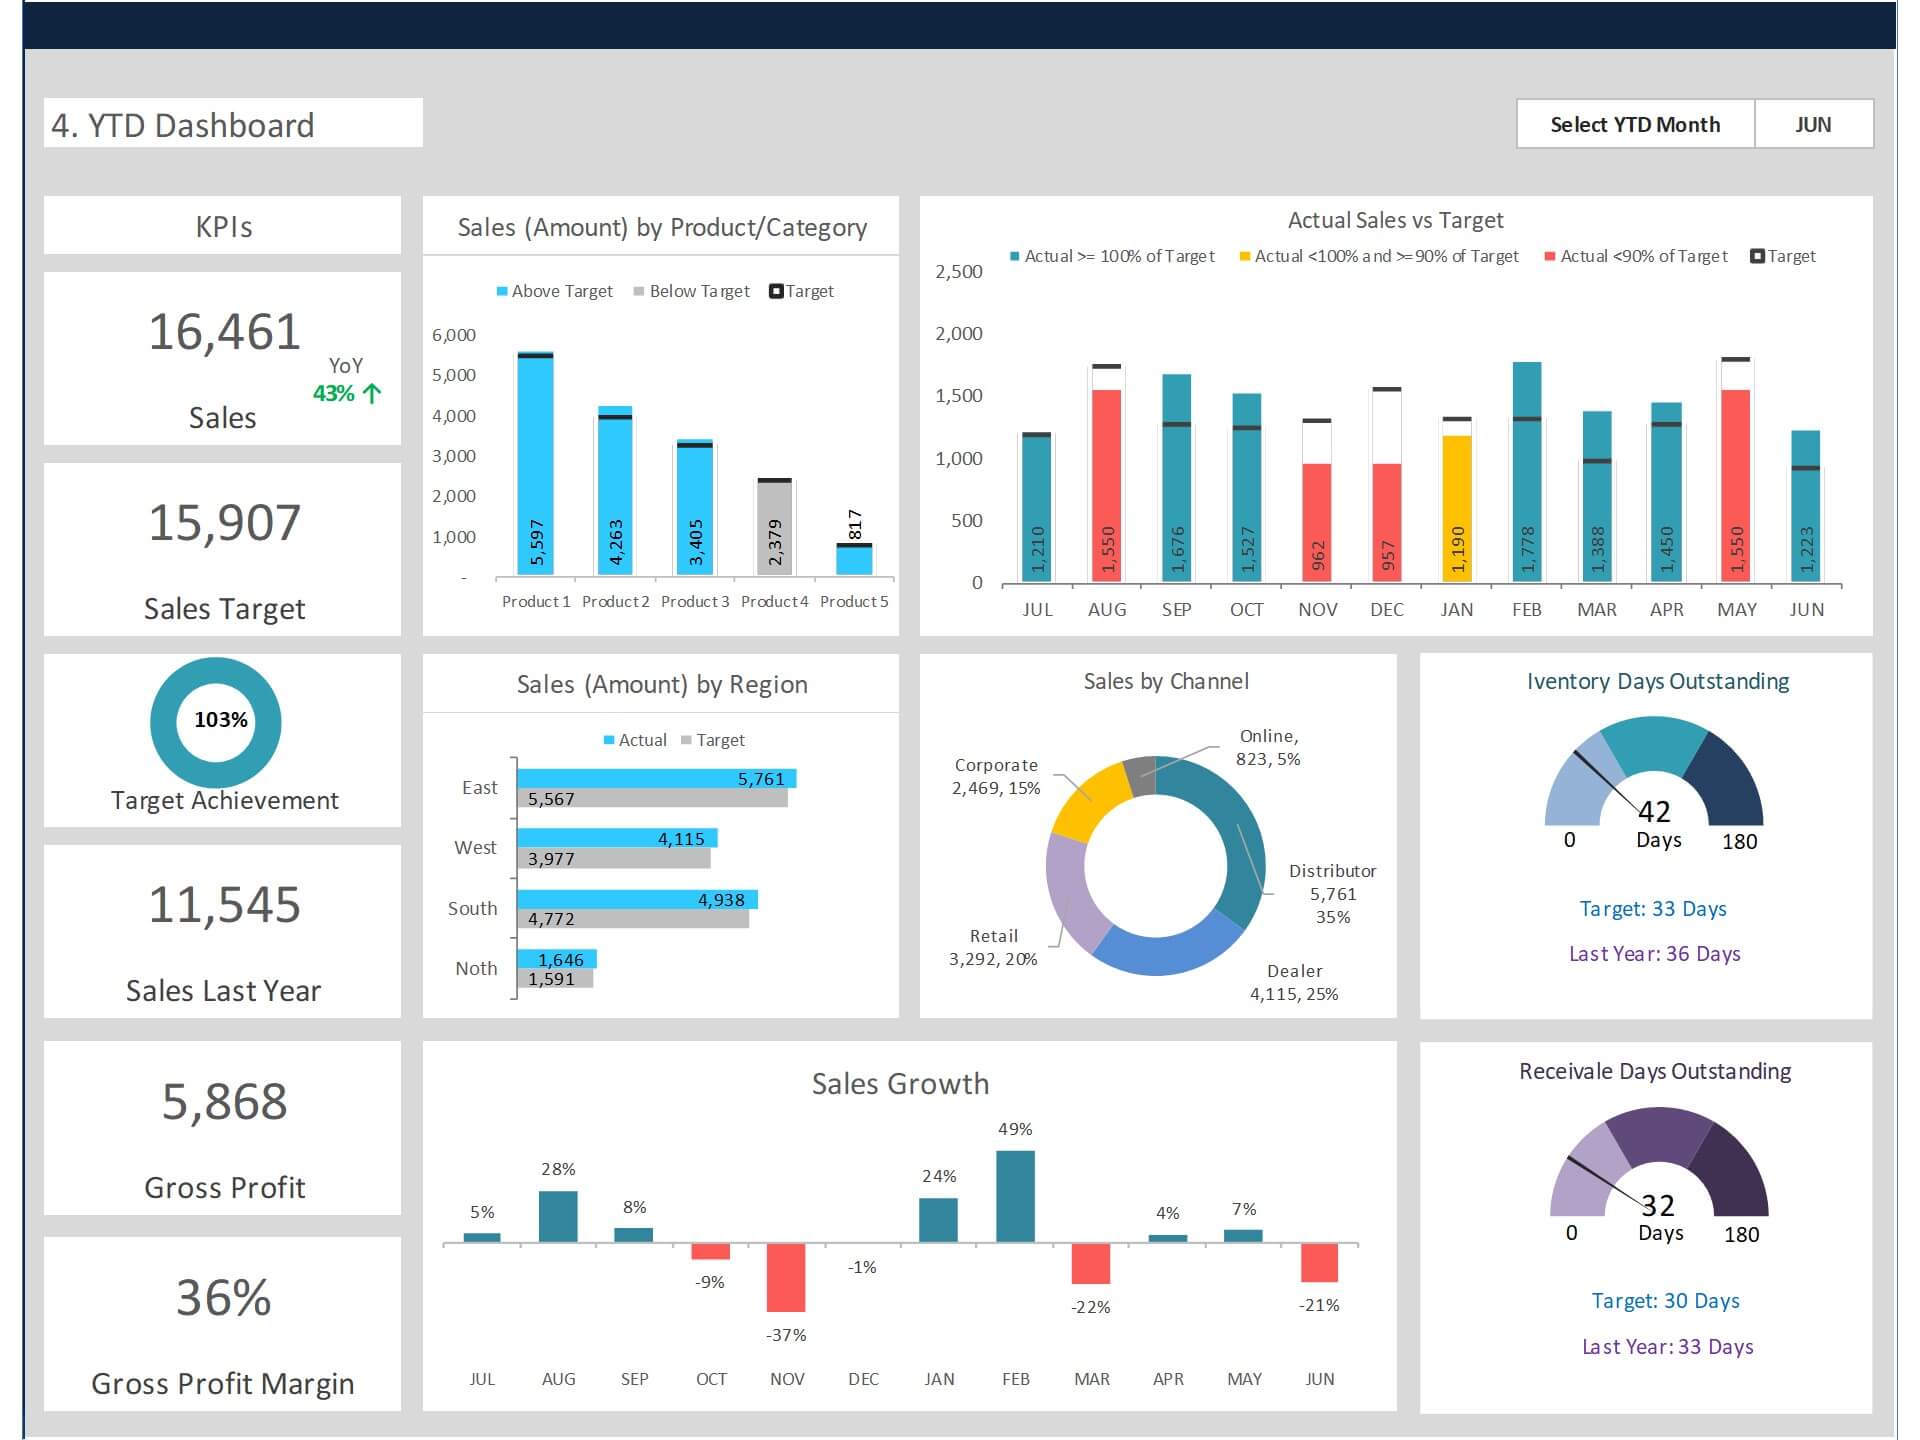
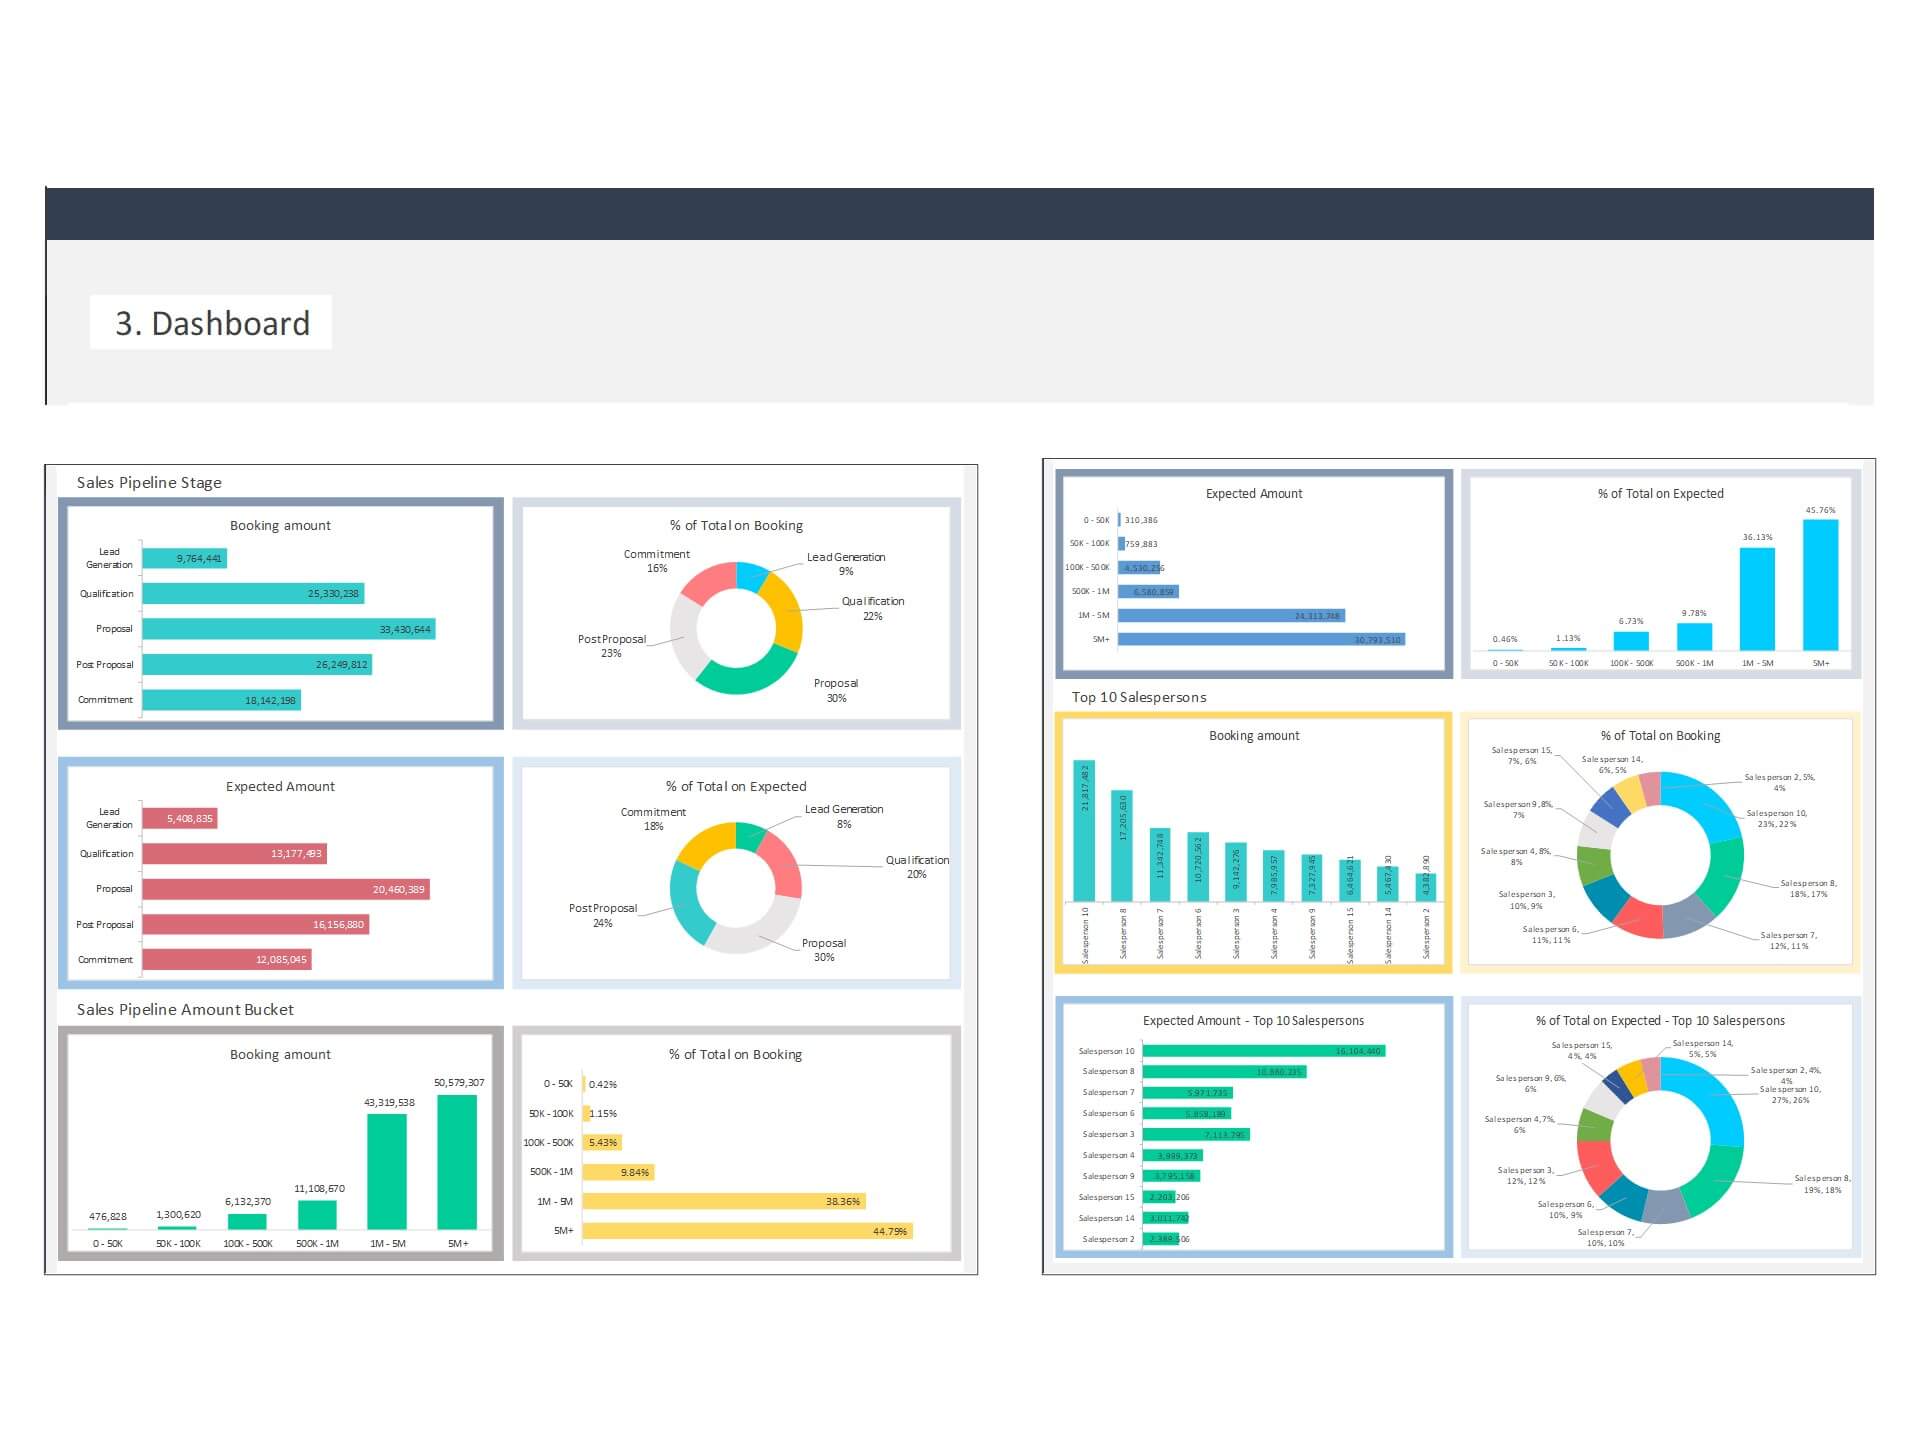
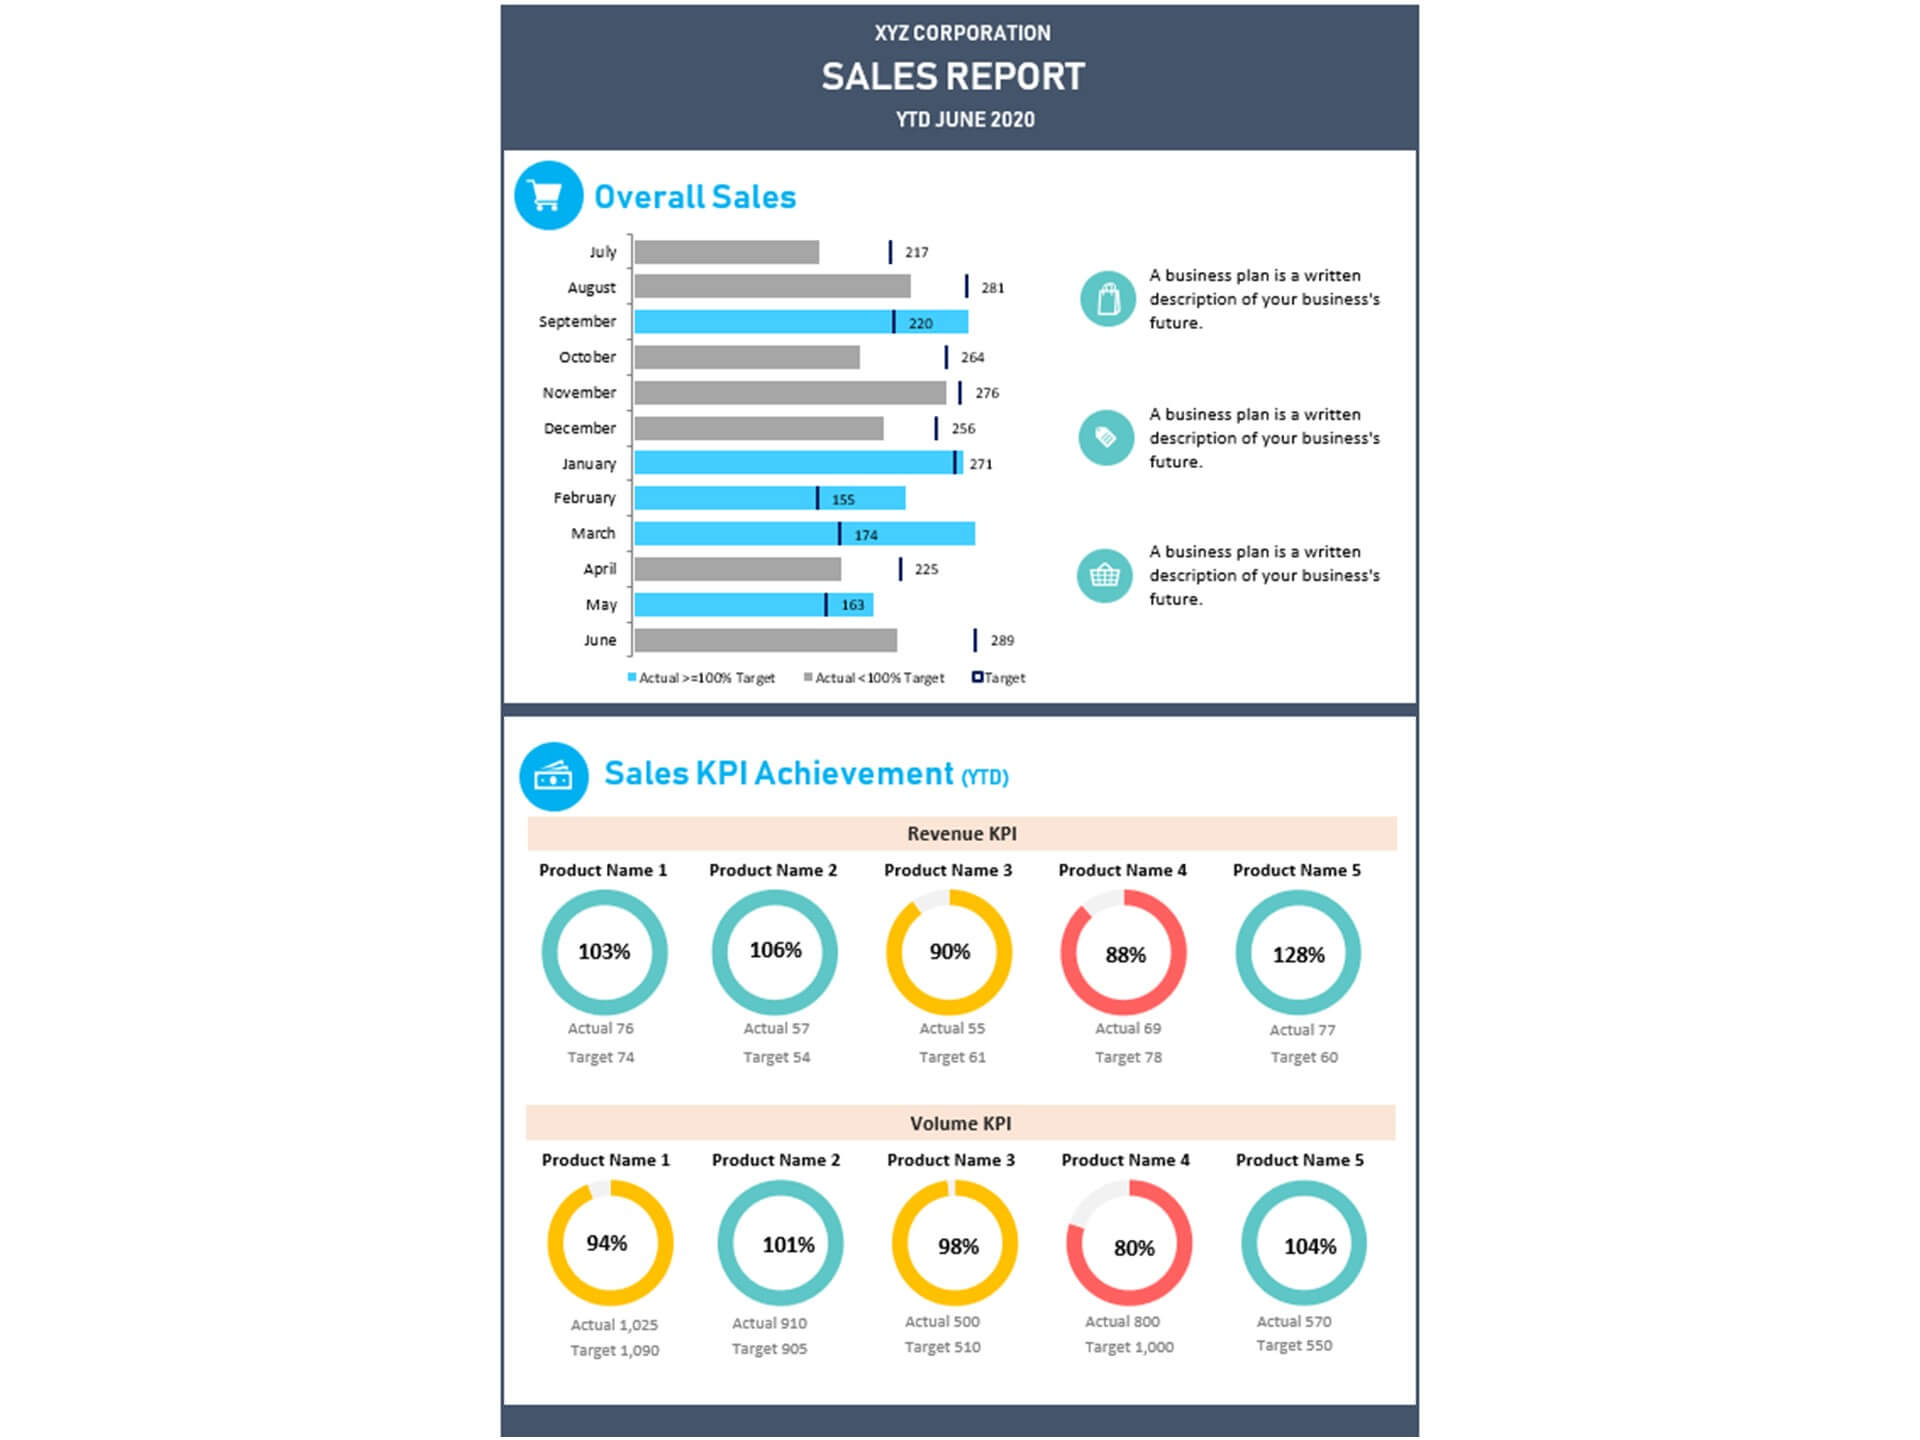
- Provides key sales insights for the CEO and sales team with details of total sales, sales by product/category, sales by channel, profitability, and receivables
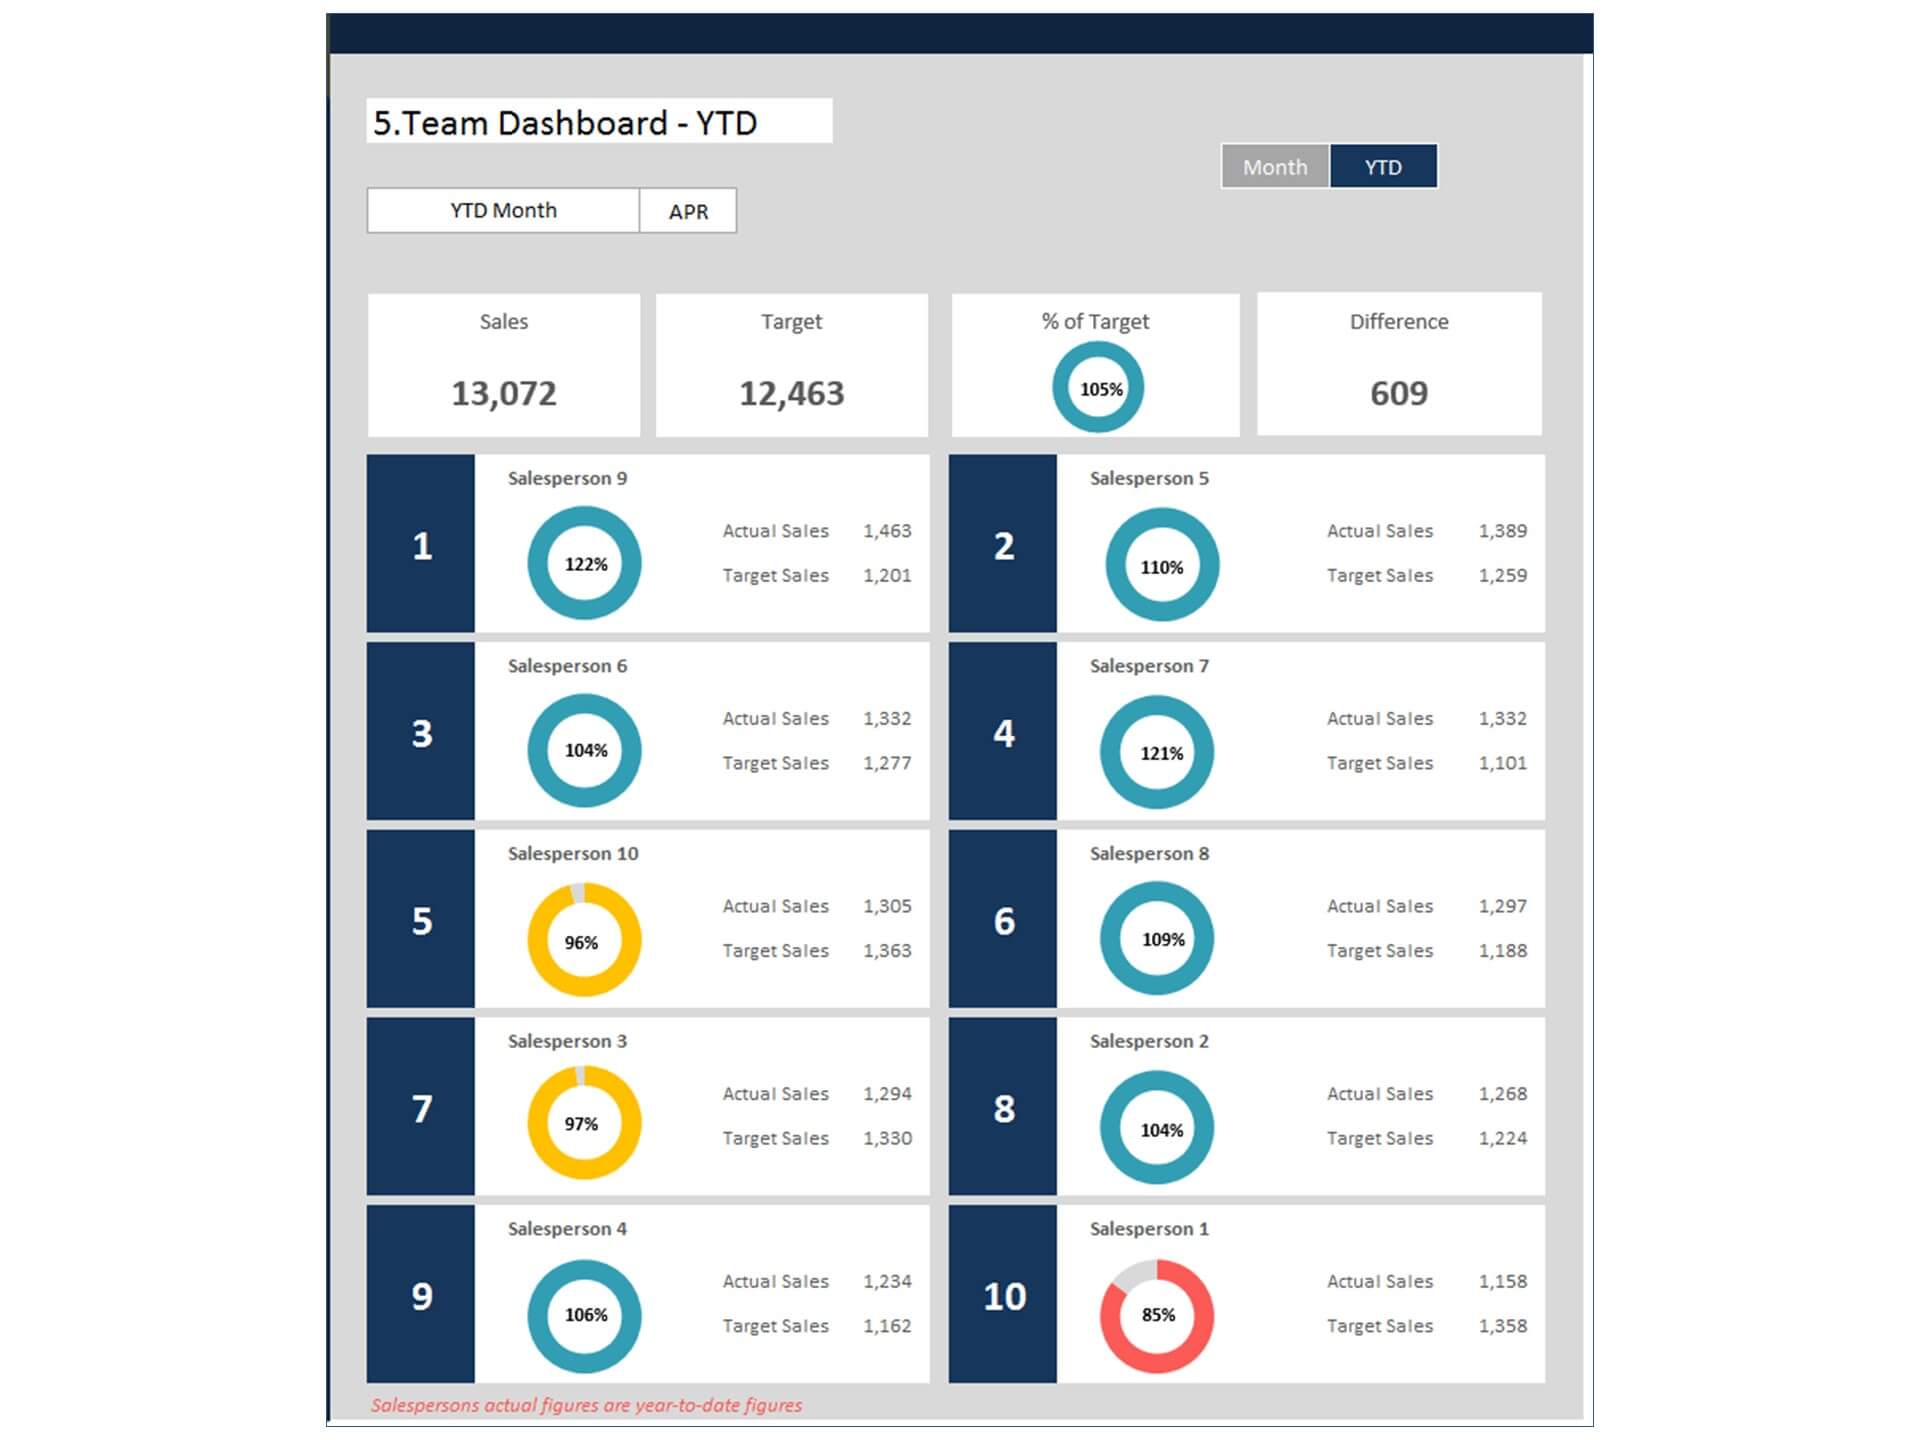
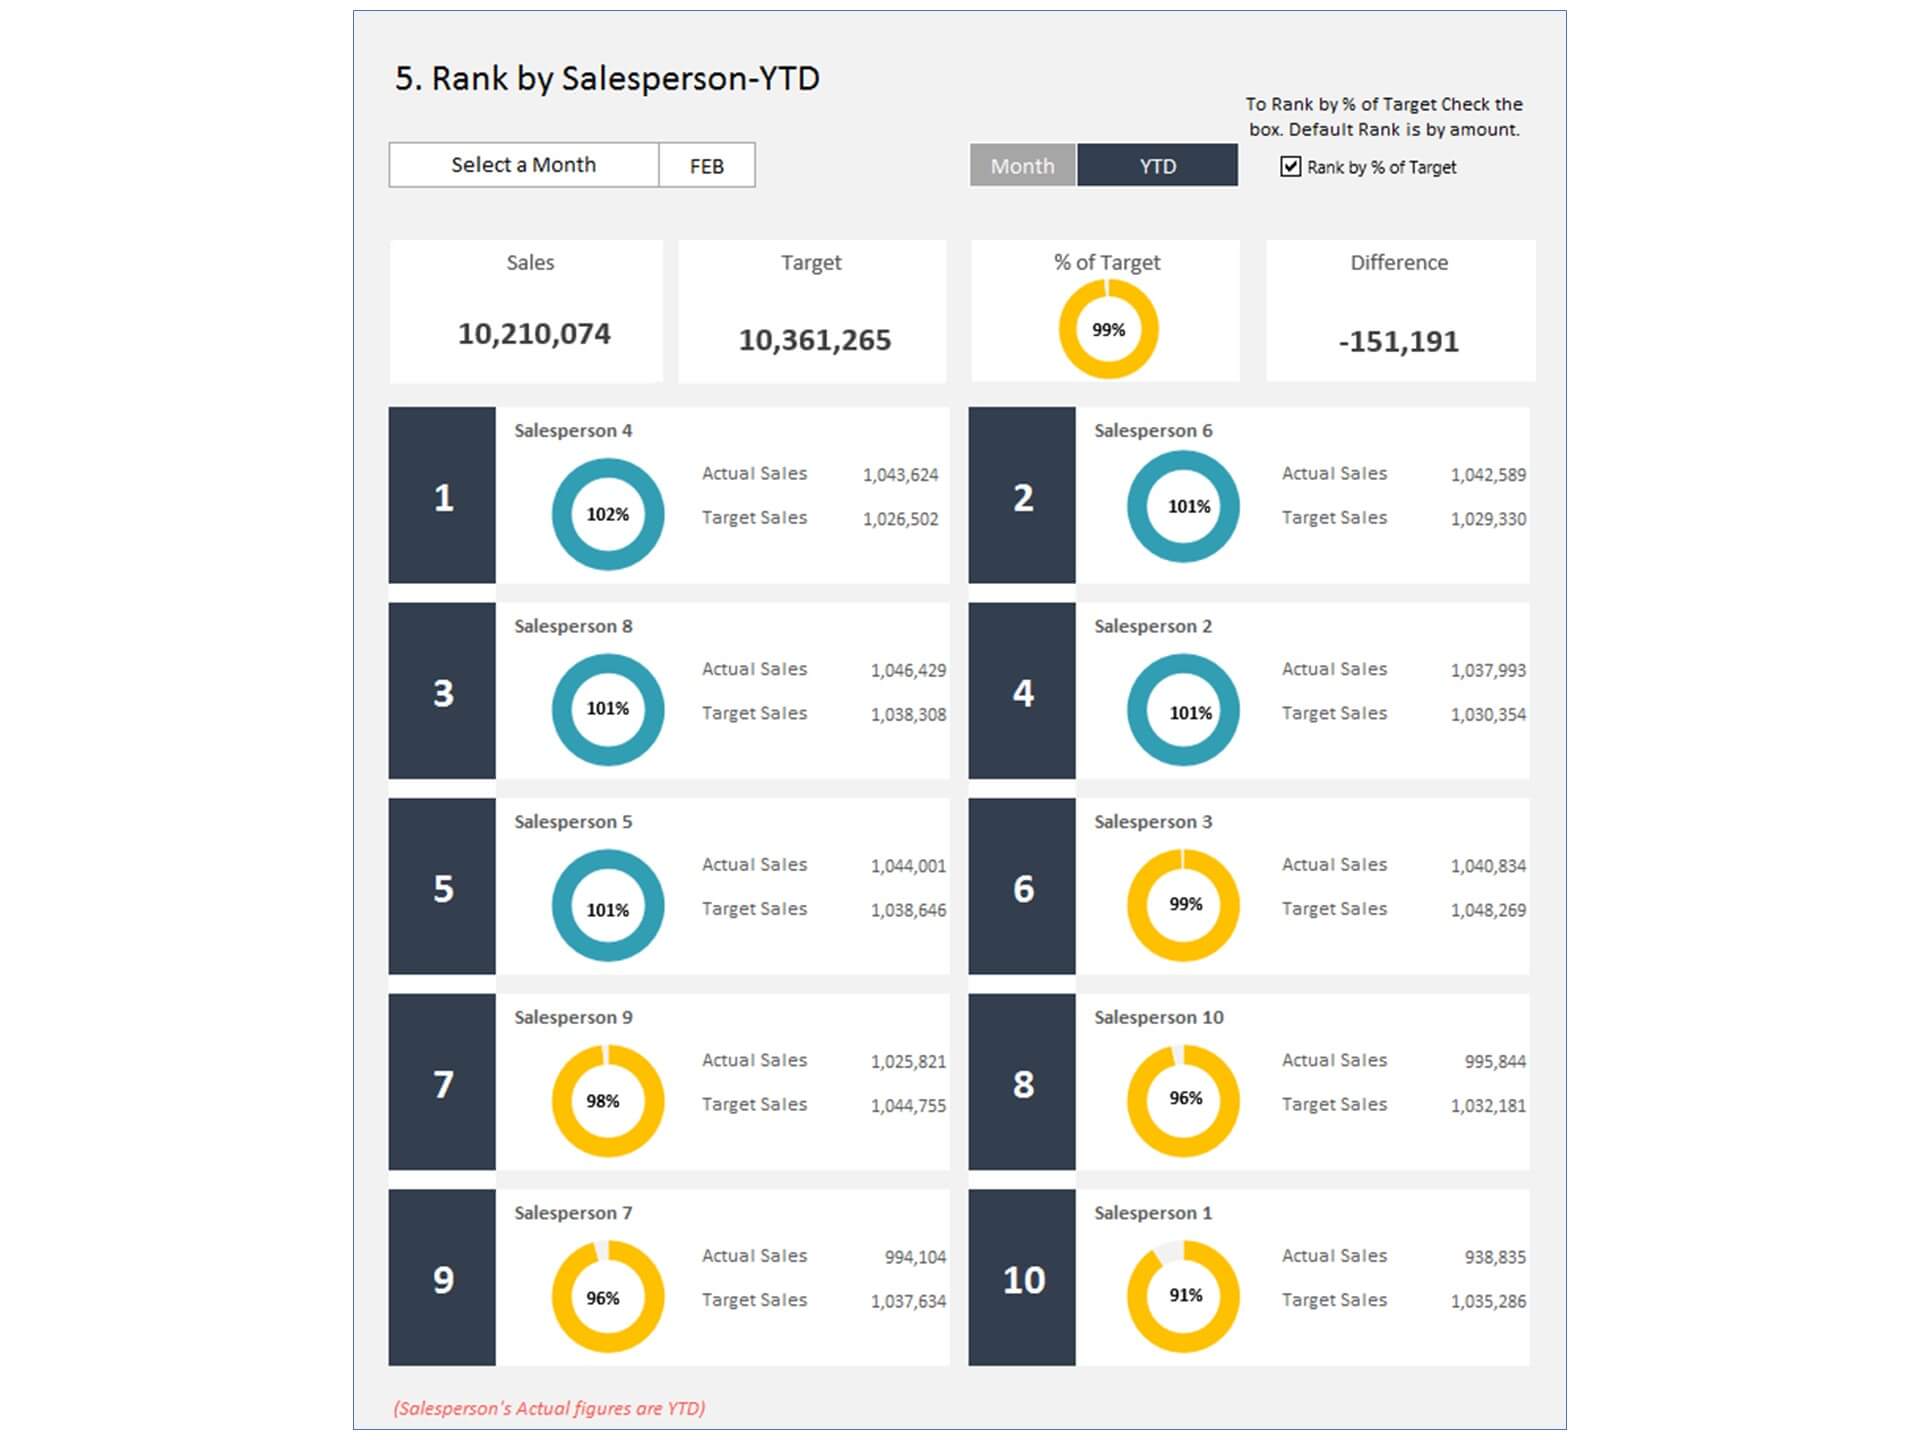
- Quickly and easily communicate to salespersons
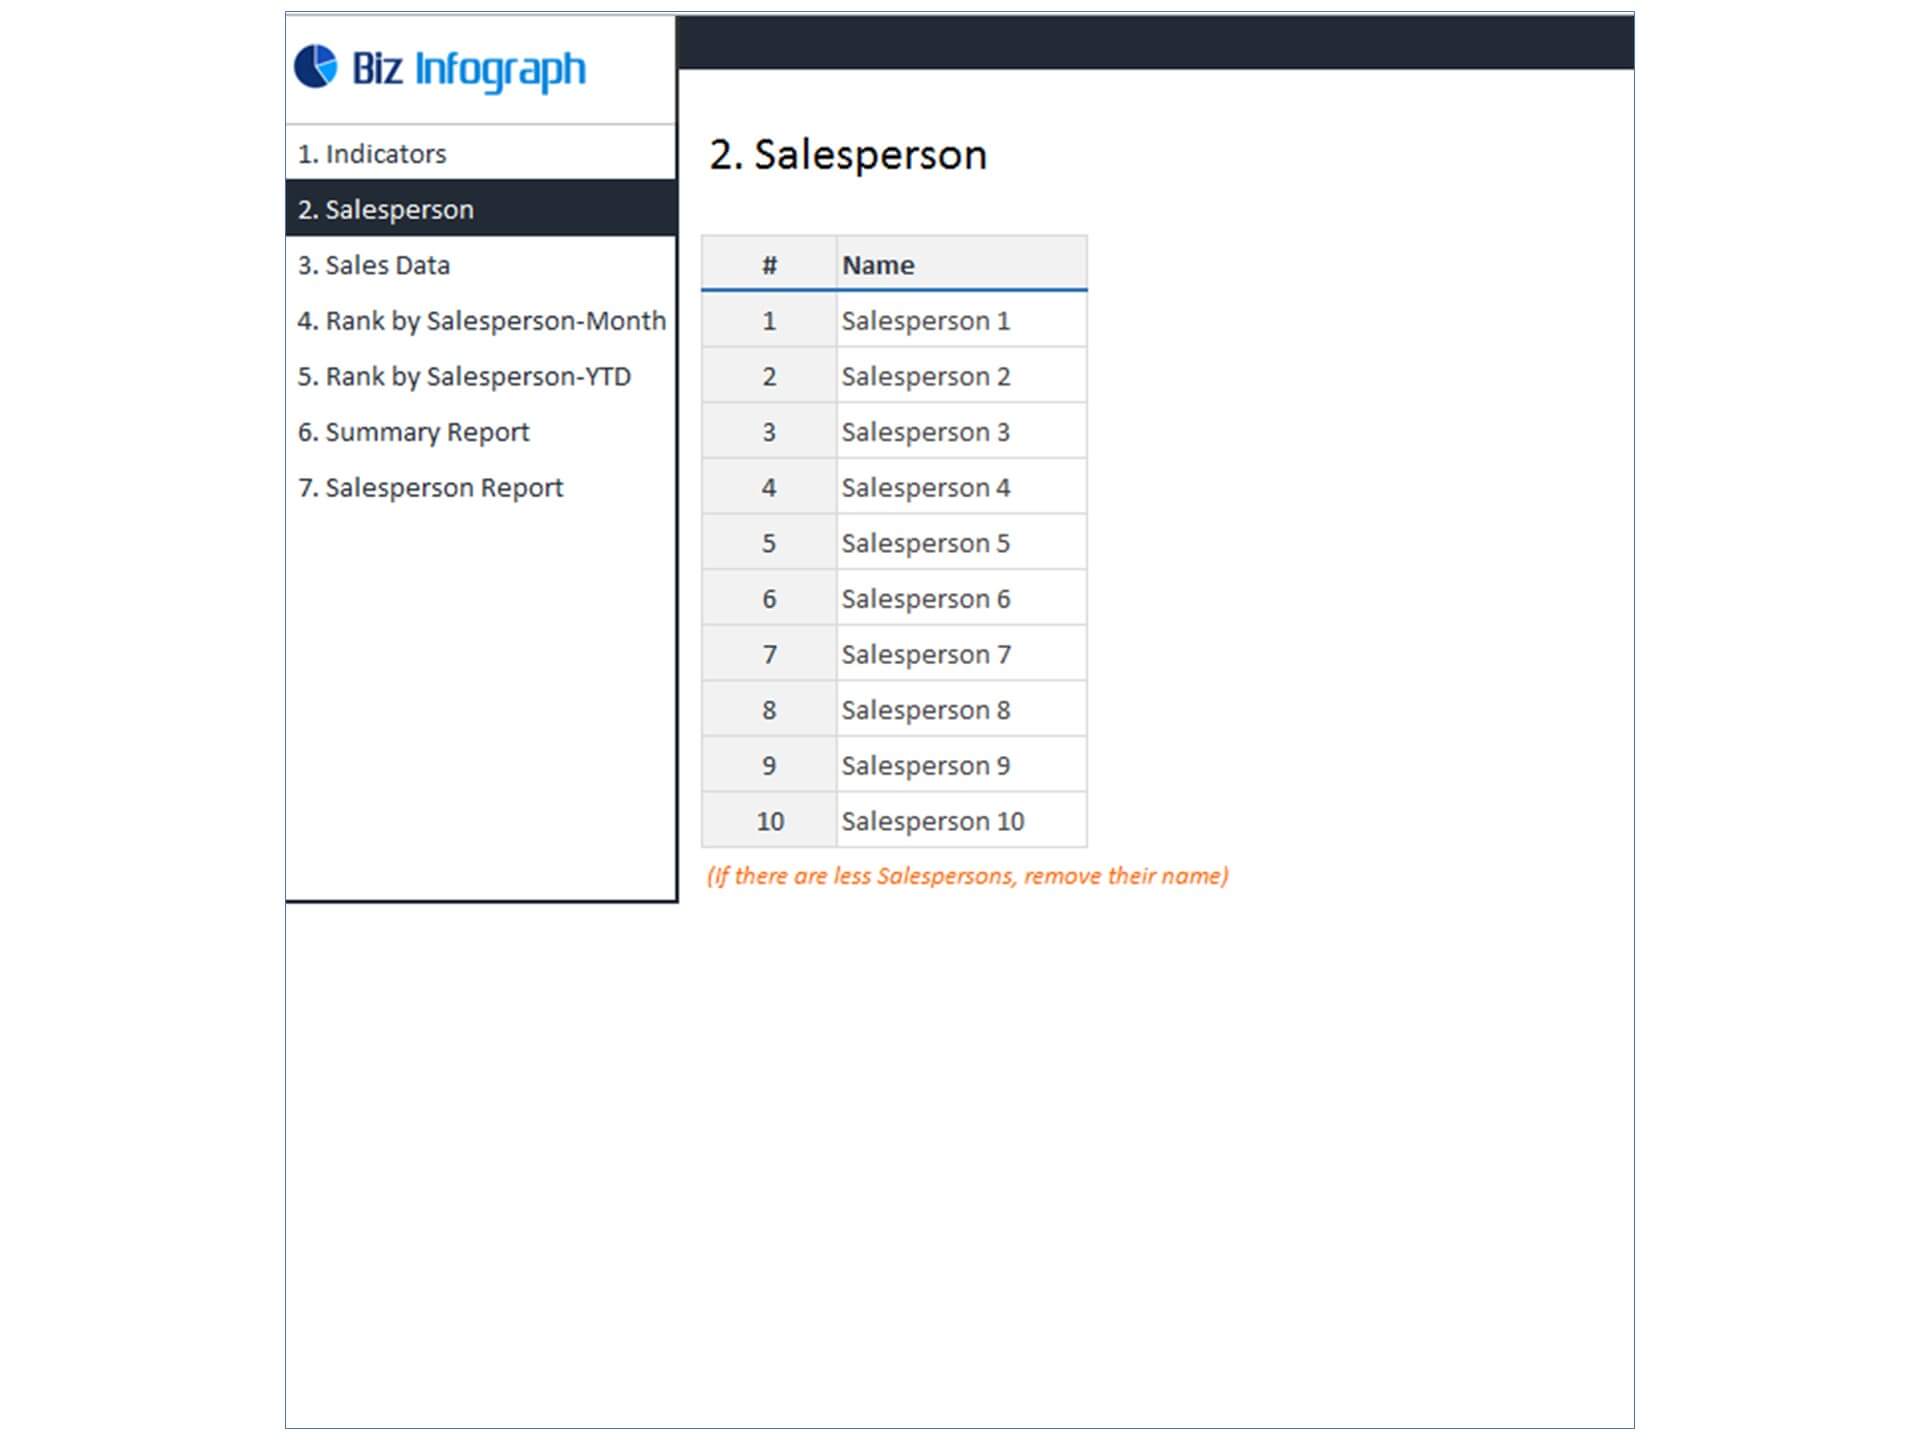
- Flexibility to add up to 20 salespersons data in the template
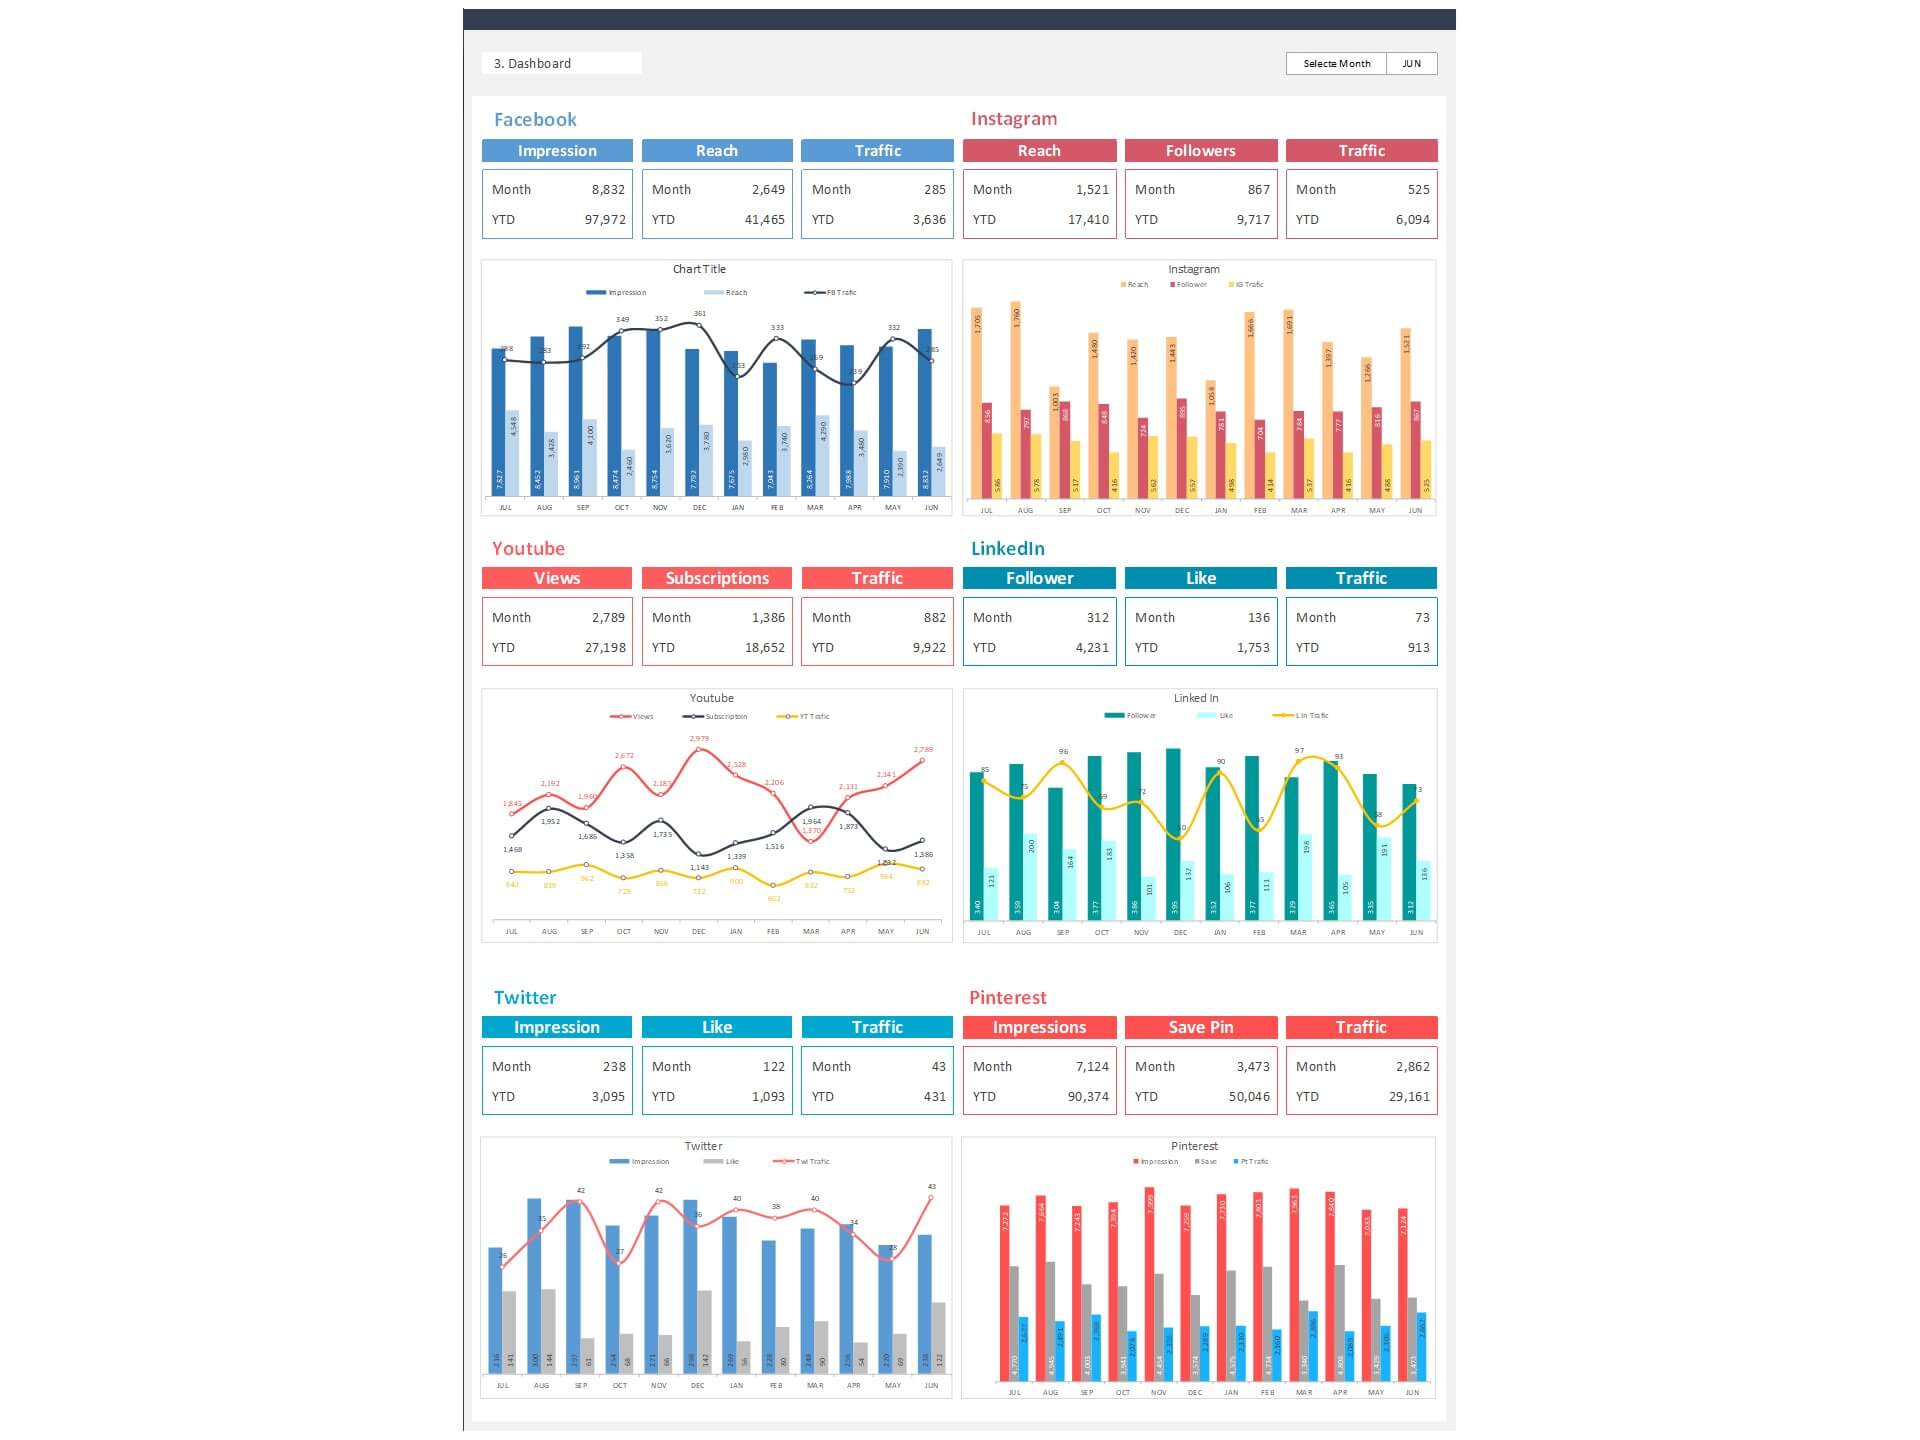
- Visualize overall sales performance
- Fully editable, easy to use, template with sample data
- Eye-catching design and customizable
- Change the sample data with your data
- Spreadsheets ready for printing without Biz Infograph logo
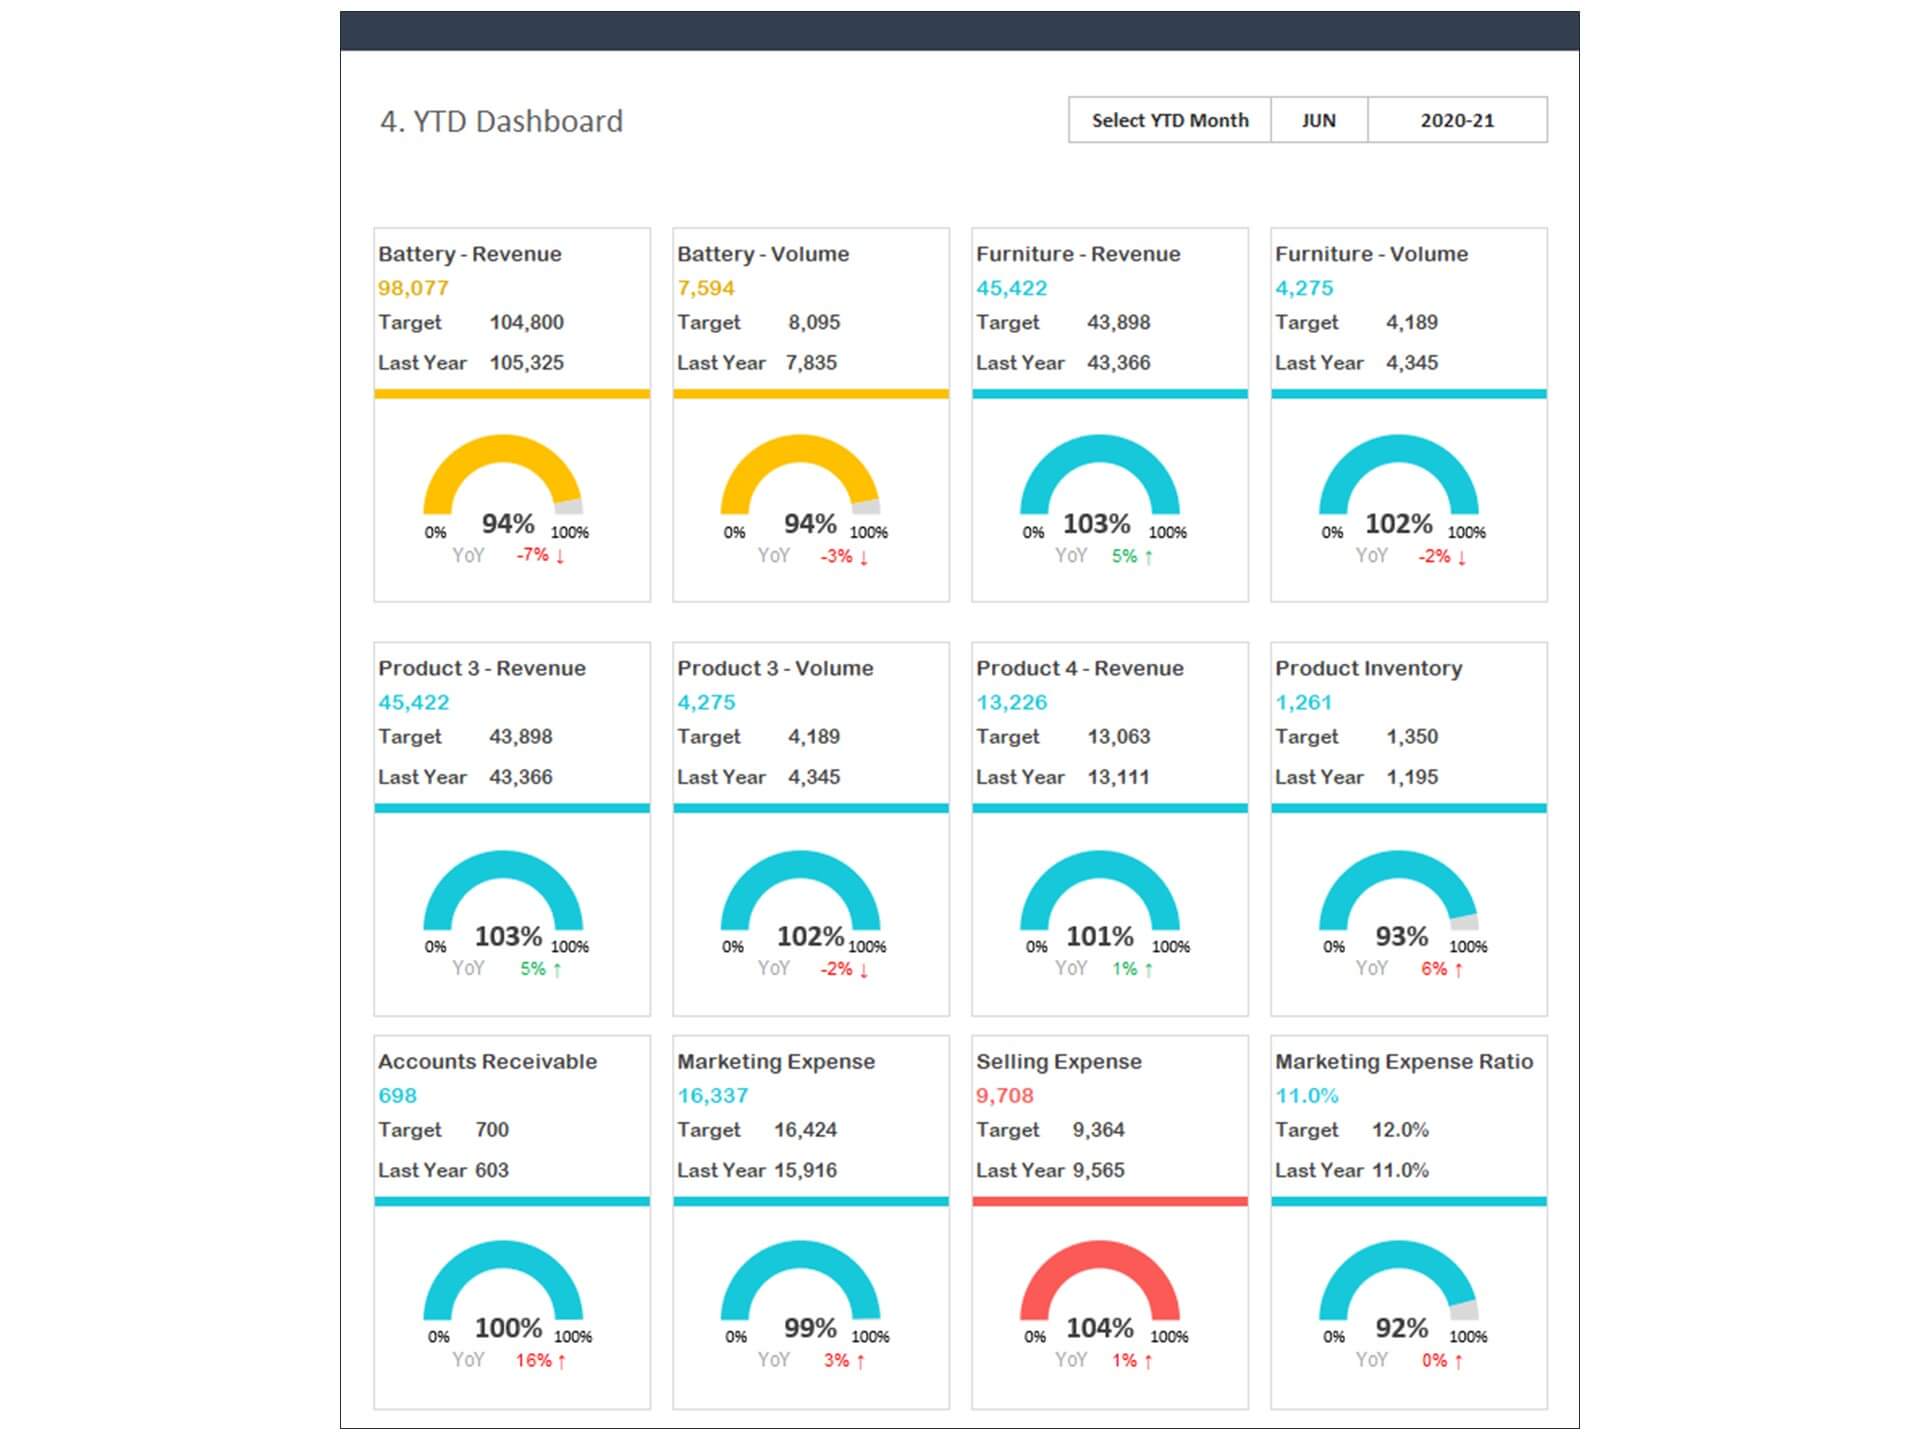
- Consolidate key financial performance indicators in one dashboard
- No monthly fees
- Immediate download
- No VBA, no Macro
- No installation necessary
- Professionally designed
What is included in this dashboard template?
- Just plug your data, the dashboard will be ready instantly and start using.
- A text file which contains a password to view and edit the formula
- A guide to unlocking all the elements in the dashboard
Professional Support:
- Video tutorial guide on how to navigate and use the Sales Tracking Dashboard Template
- Professional service to customize dashboard template in excel as per business need
- Help and support in post-purchase
- Payment secured by Stripe and PayPal (no PayPal account needed)
A brief guide to using the dashboard template:
- Open the dashboard template
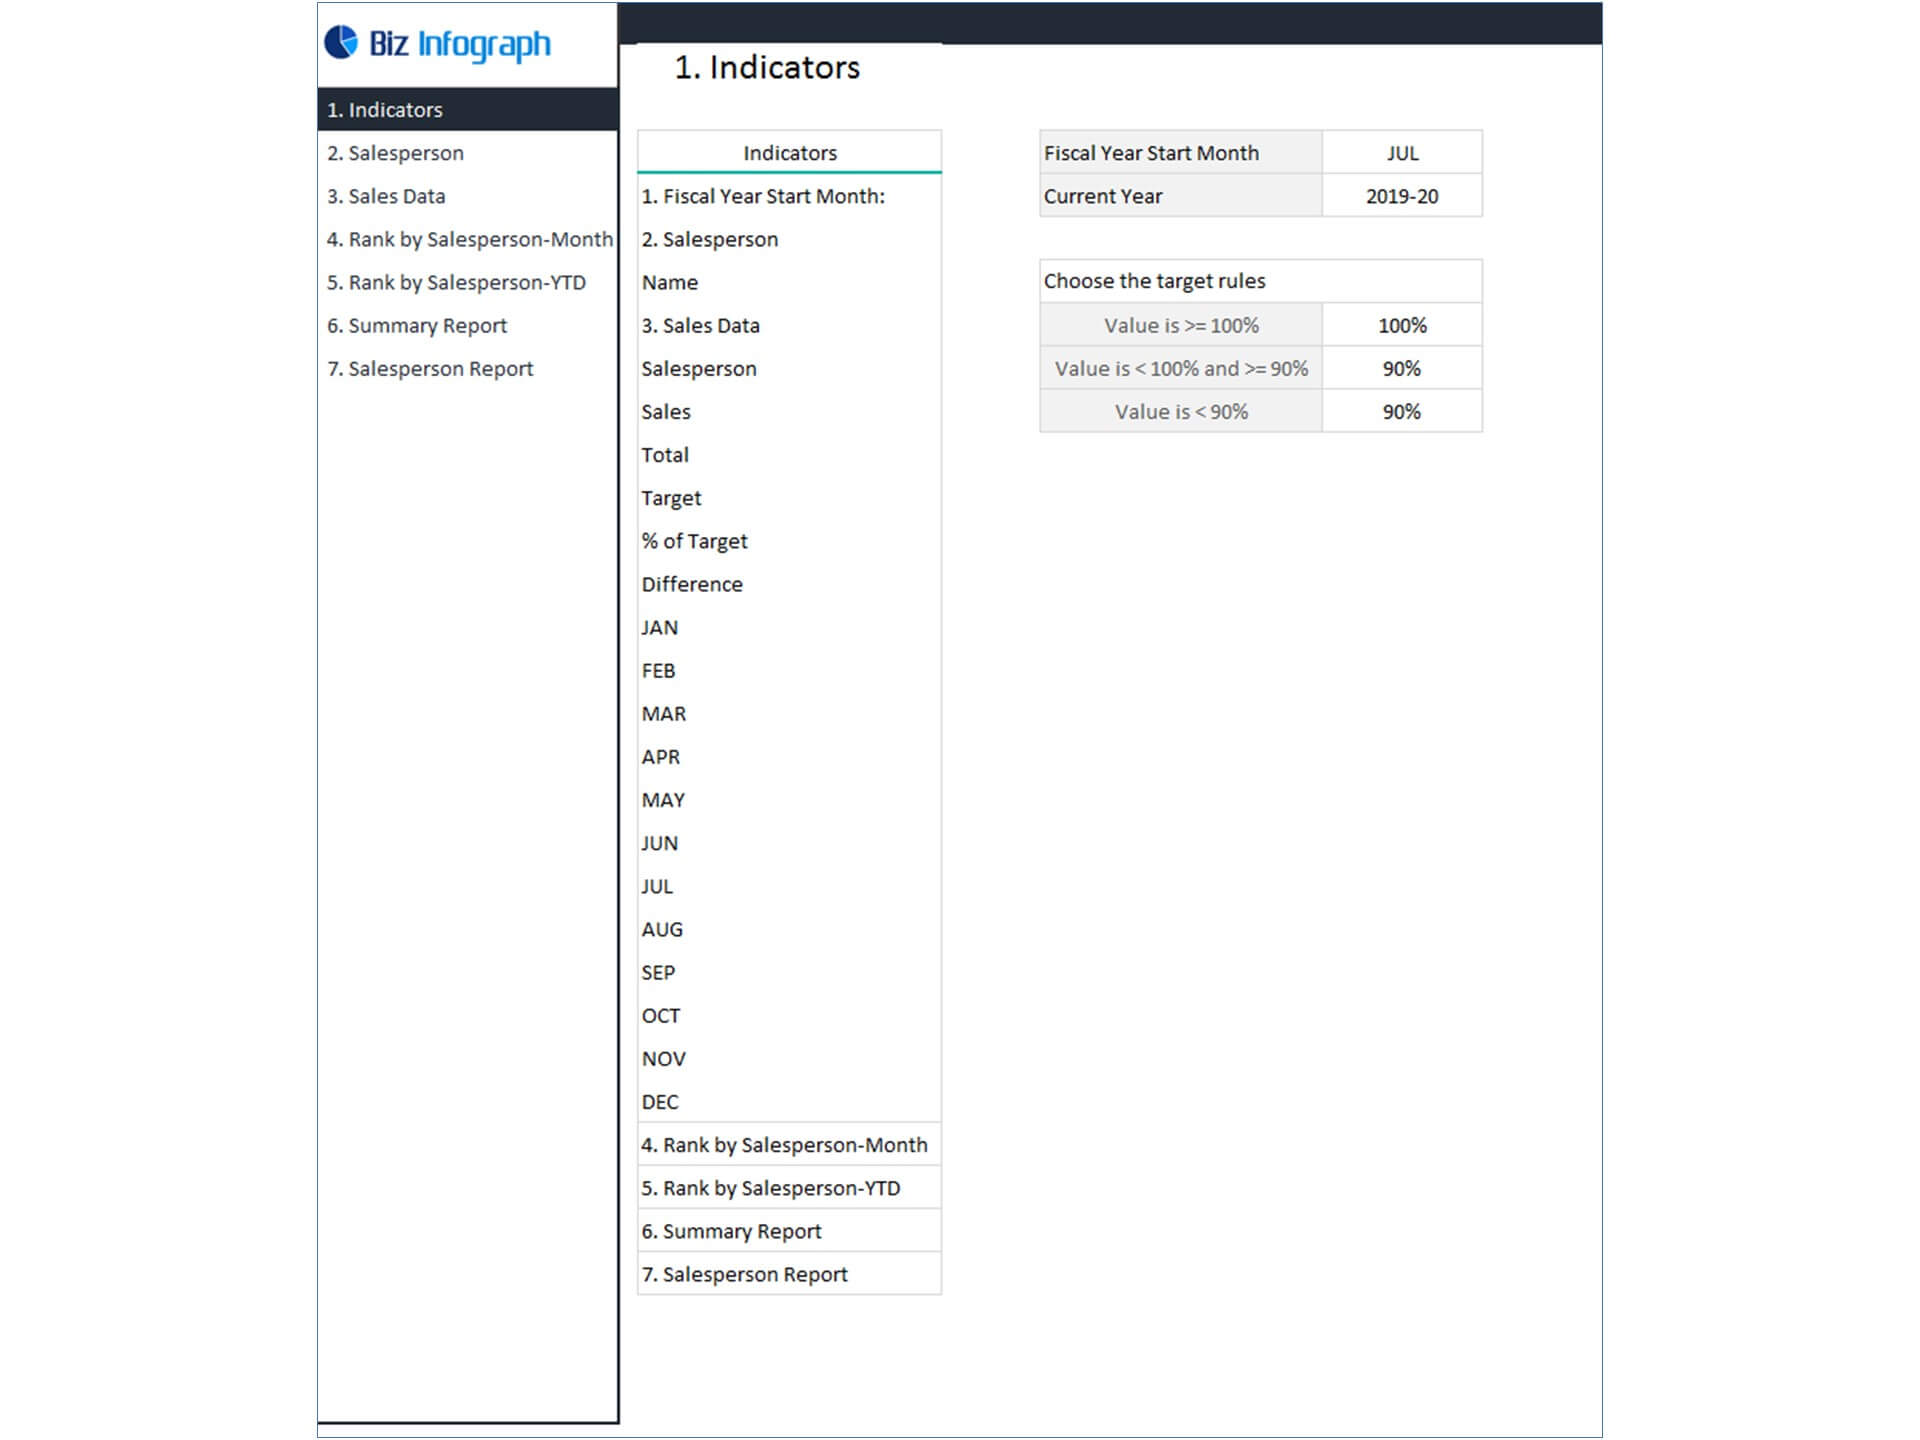
- Go to ‘Indicators’ menu – choose the start month of the fiscal year (i.e. Jan, Feb, Jul, etc.)
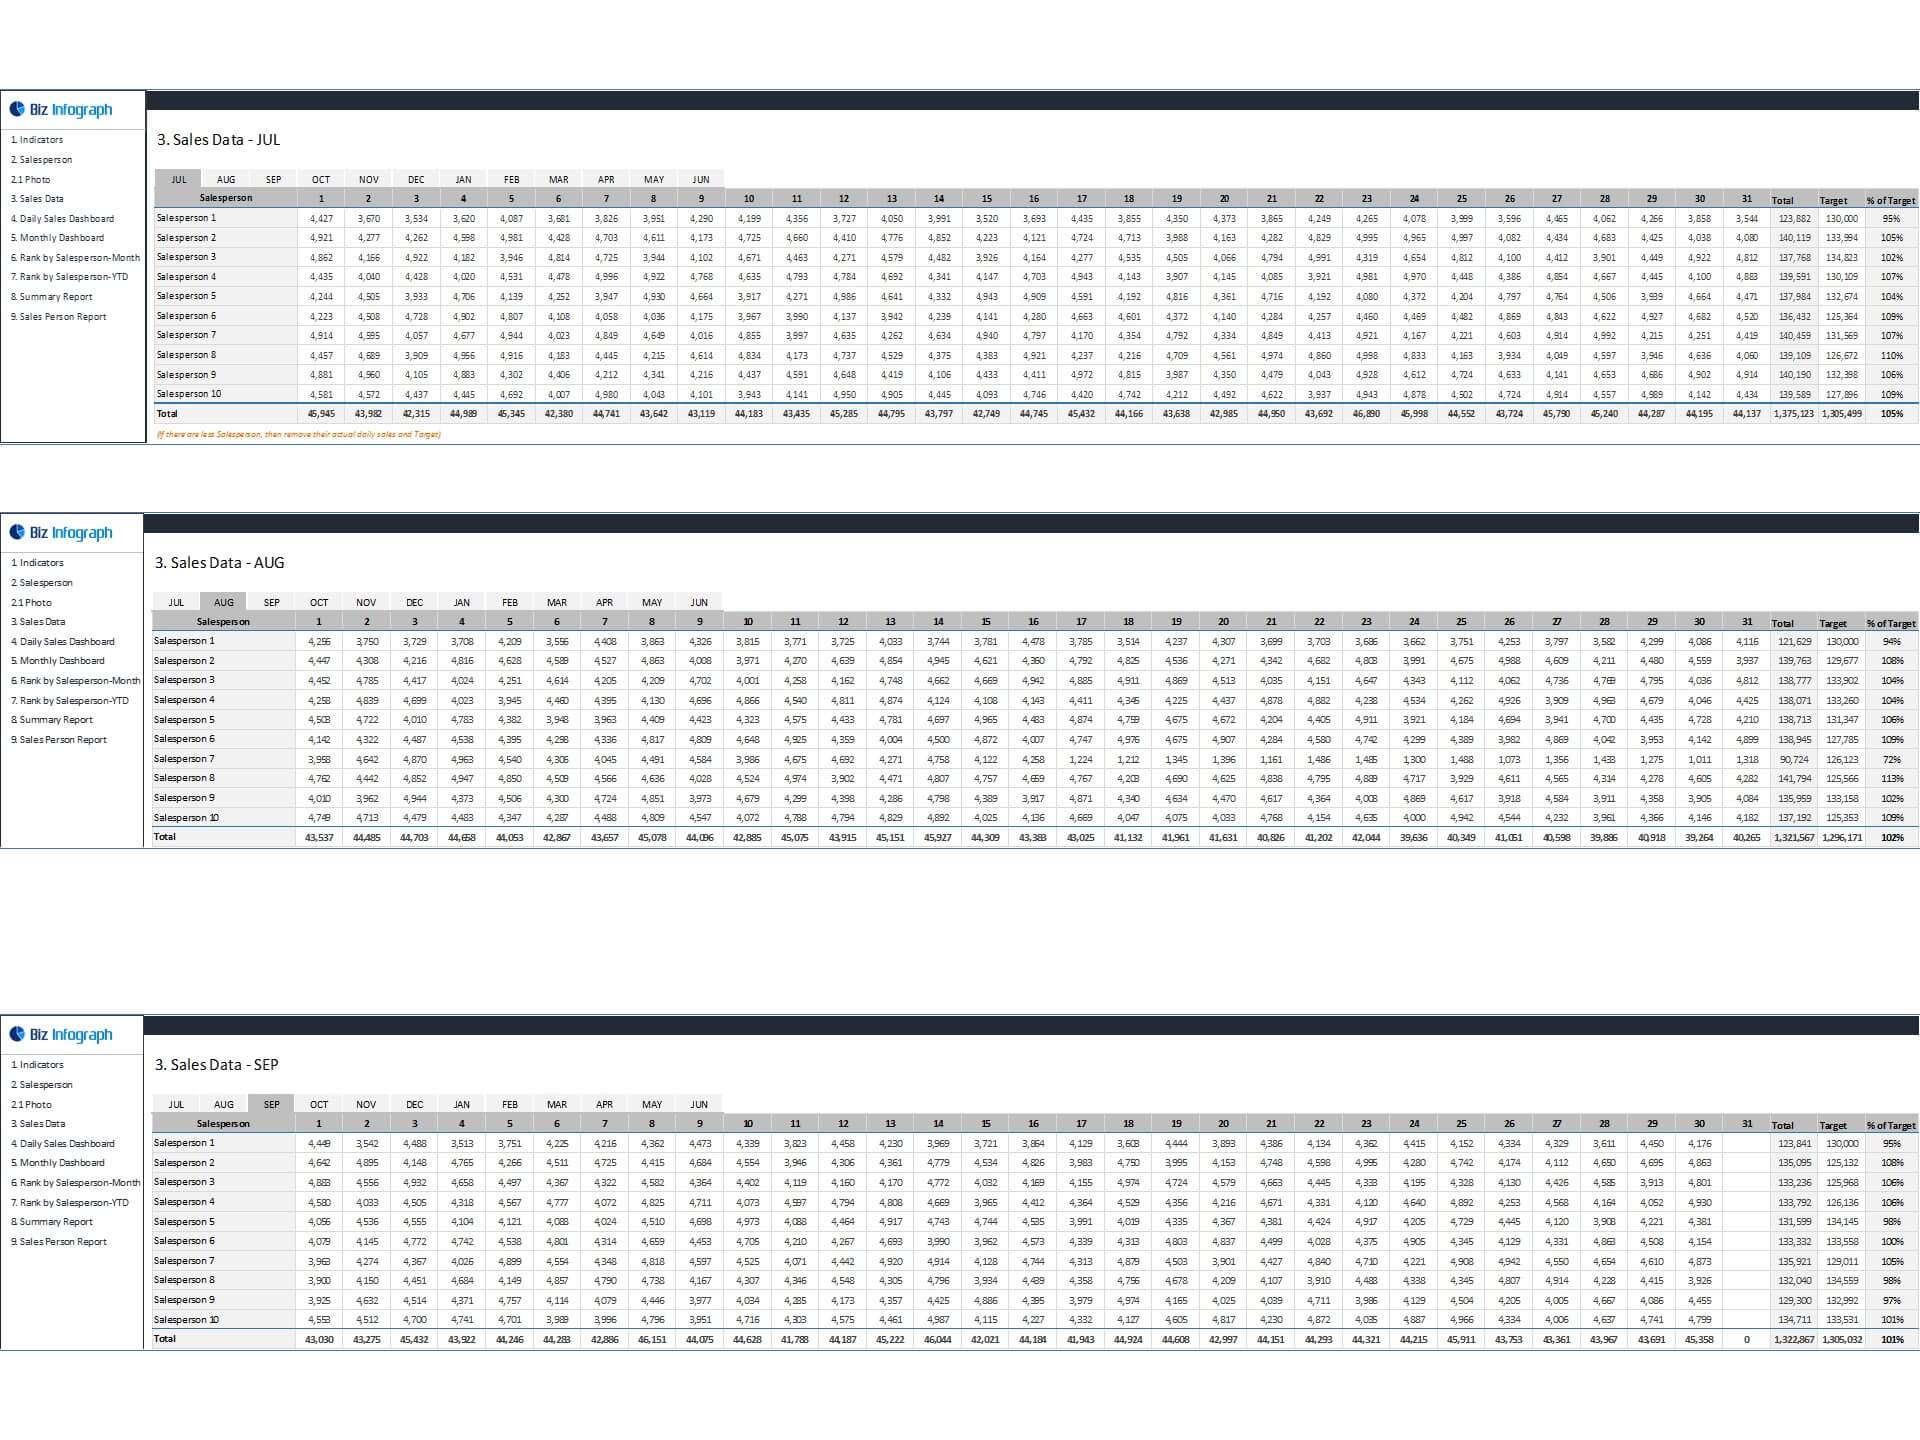
- Go to the ‘Enter Data’ menu – remove the sample data and give your actual data in the respective cells. Formula cells are locked, and you cannot edit it without a password.
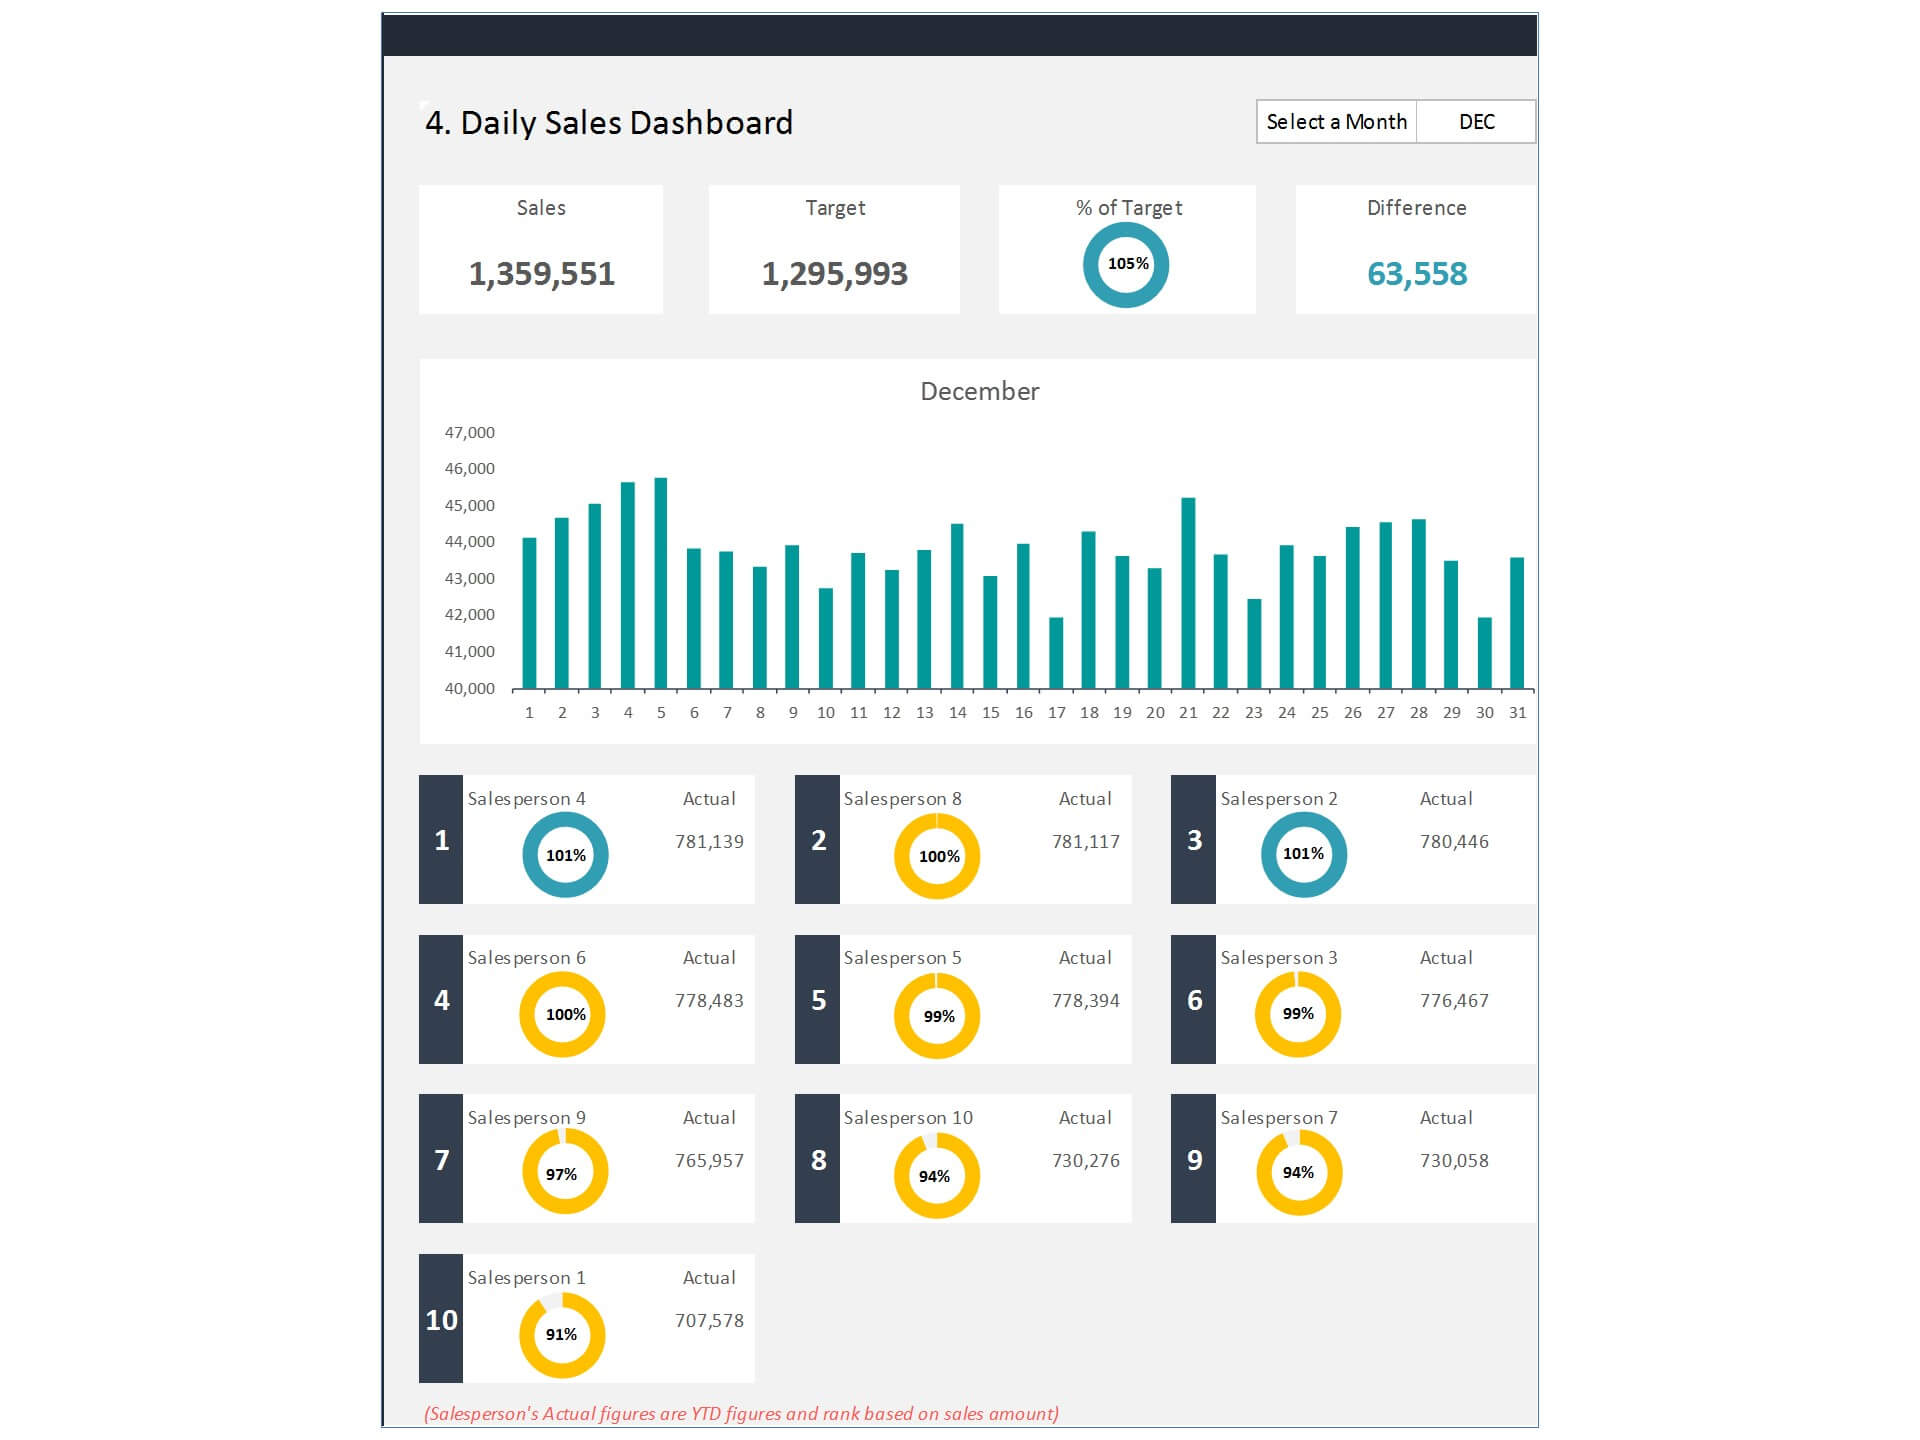
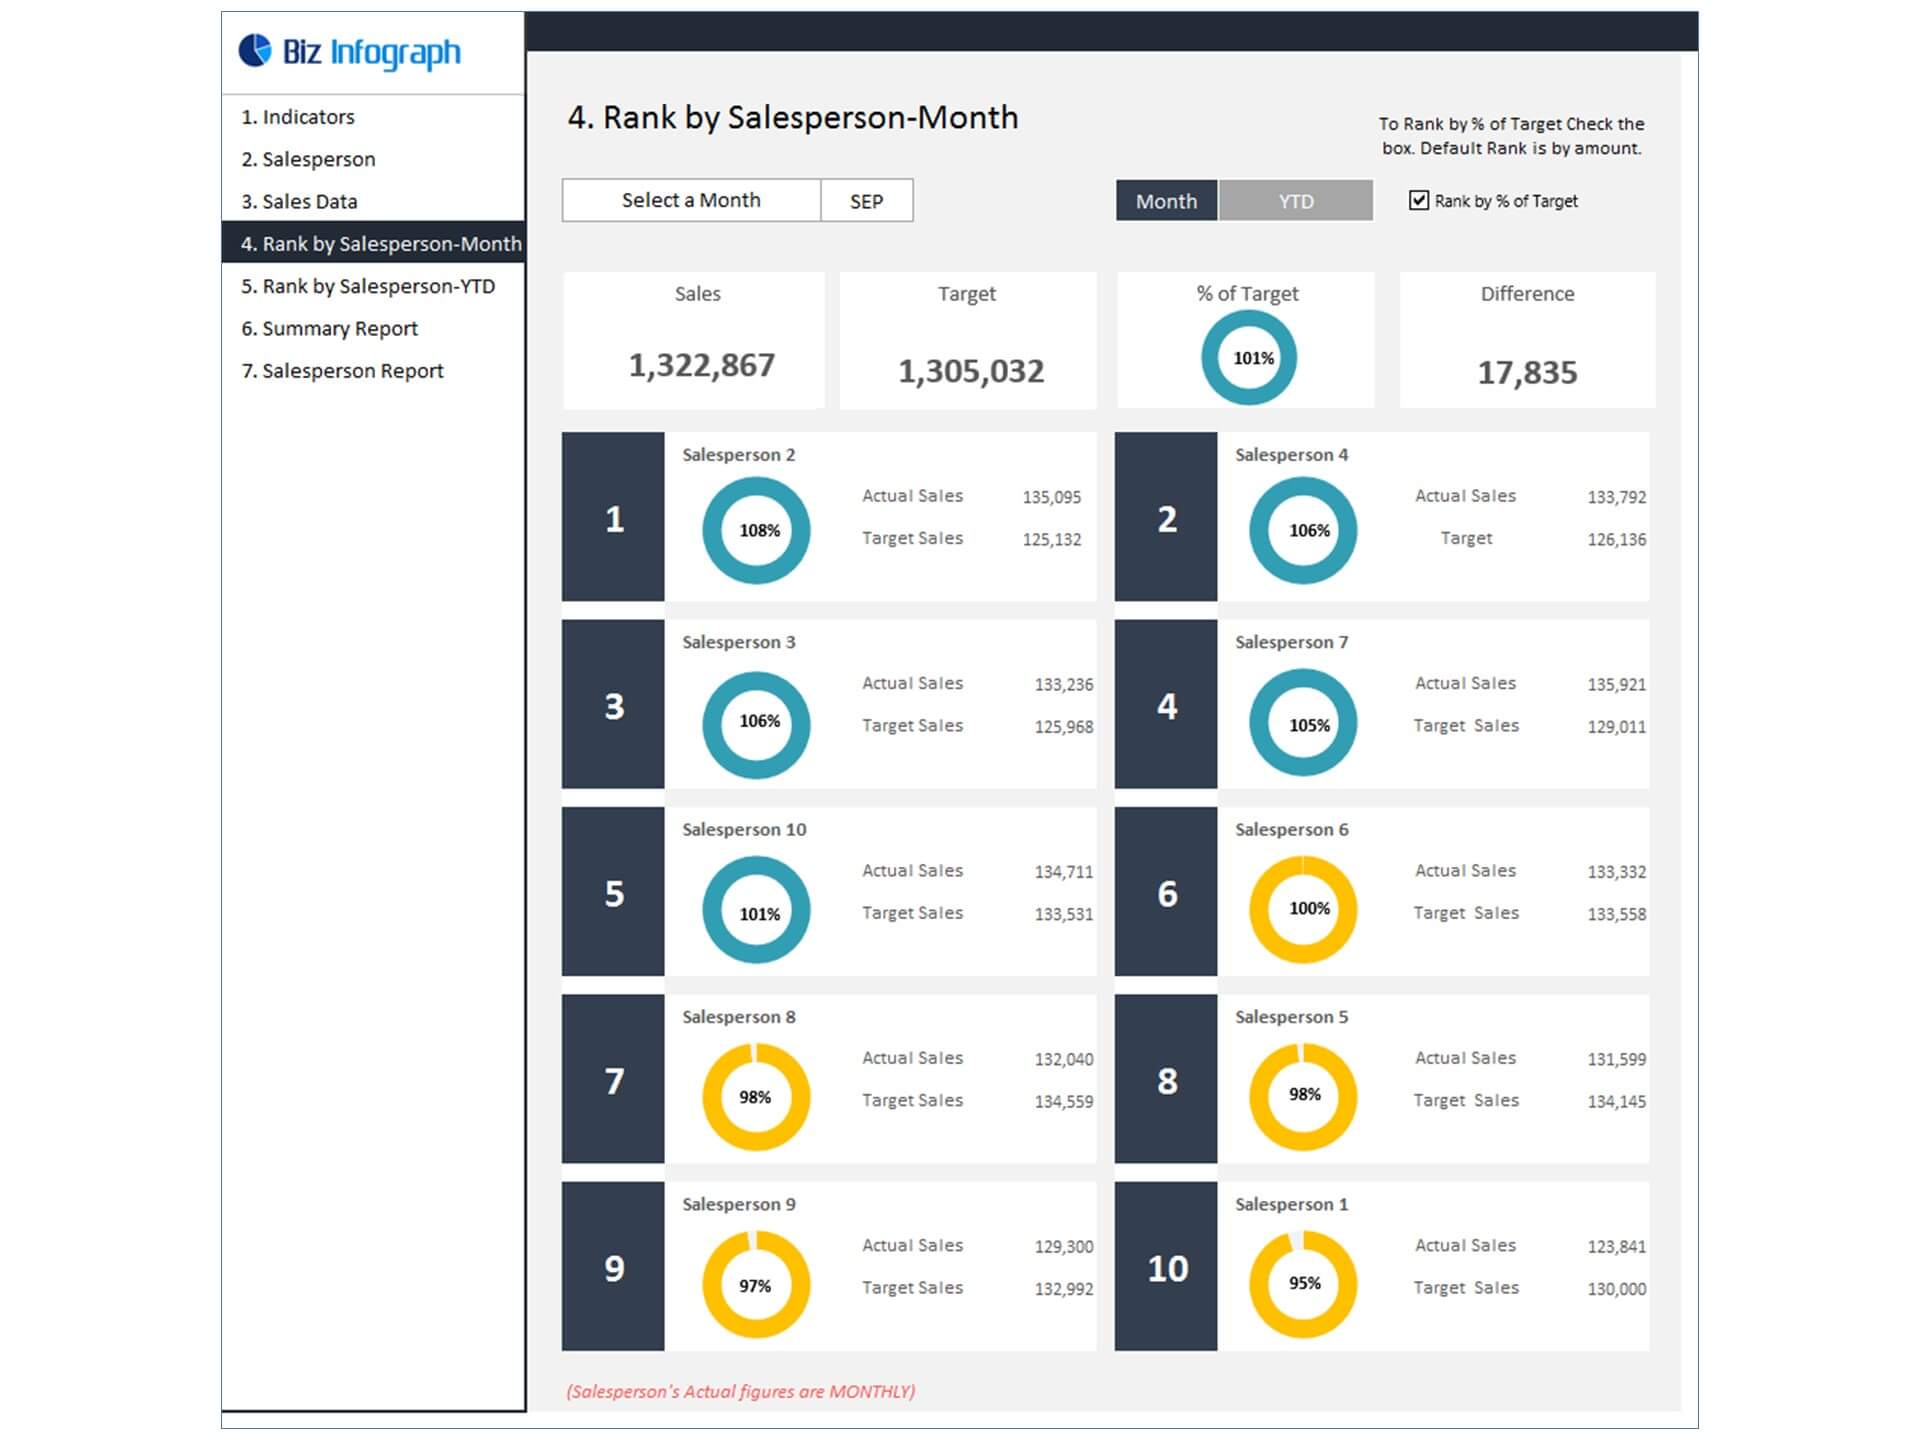
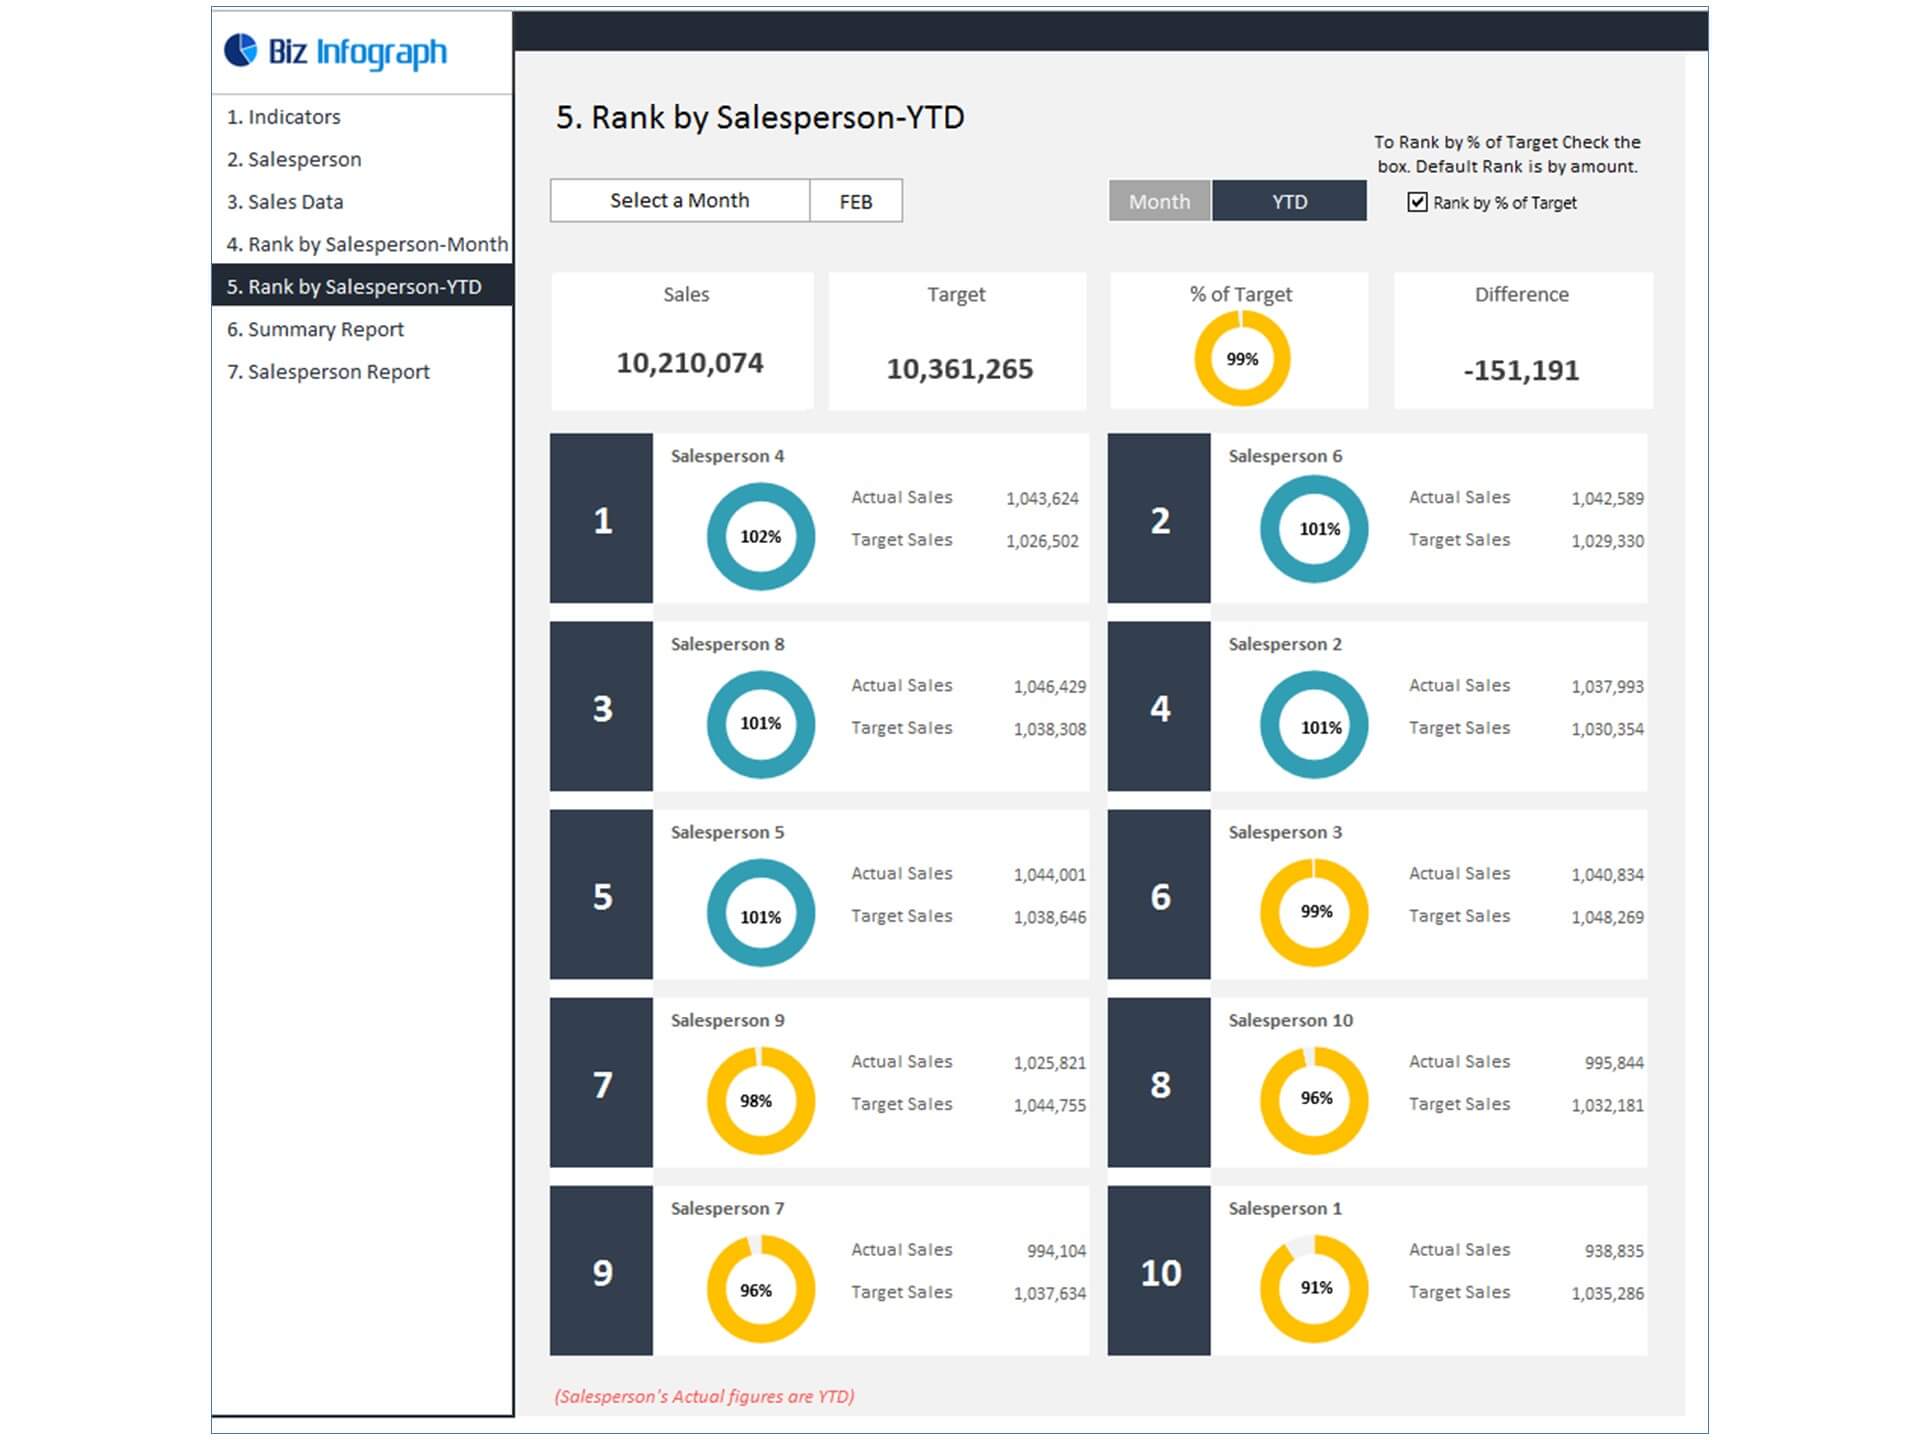
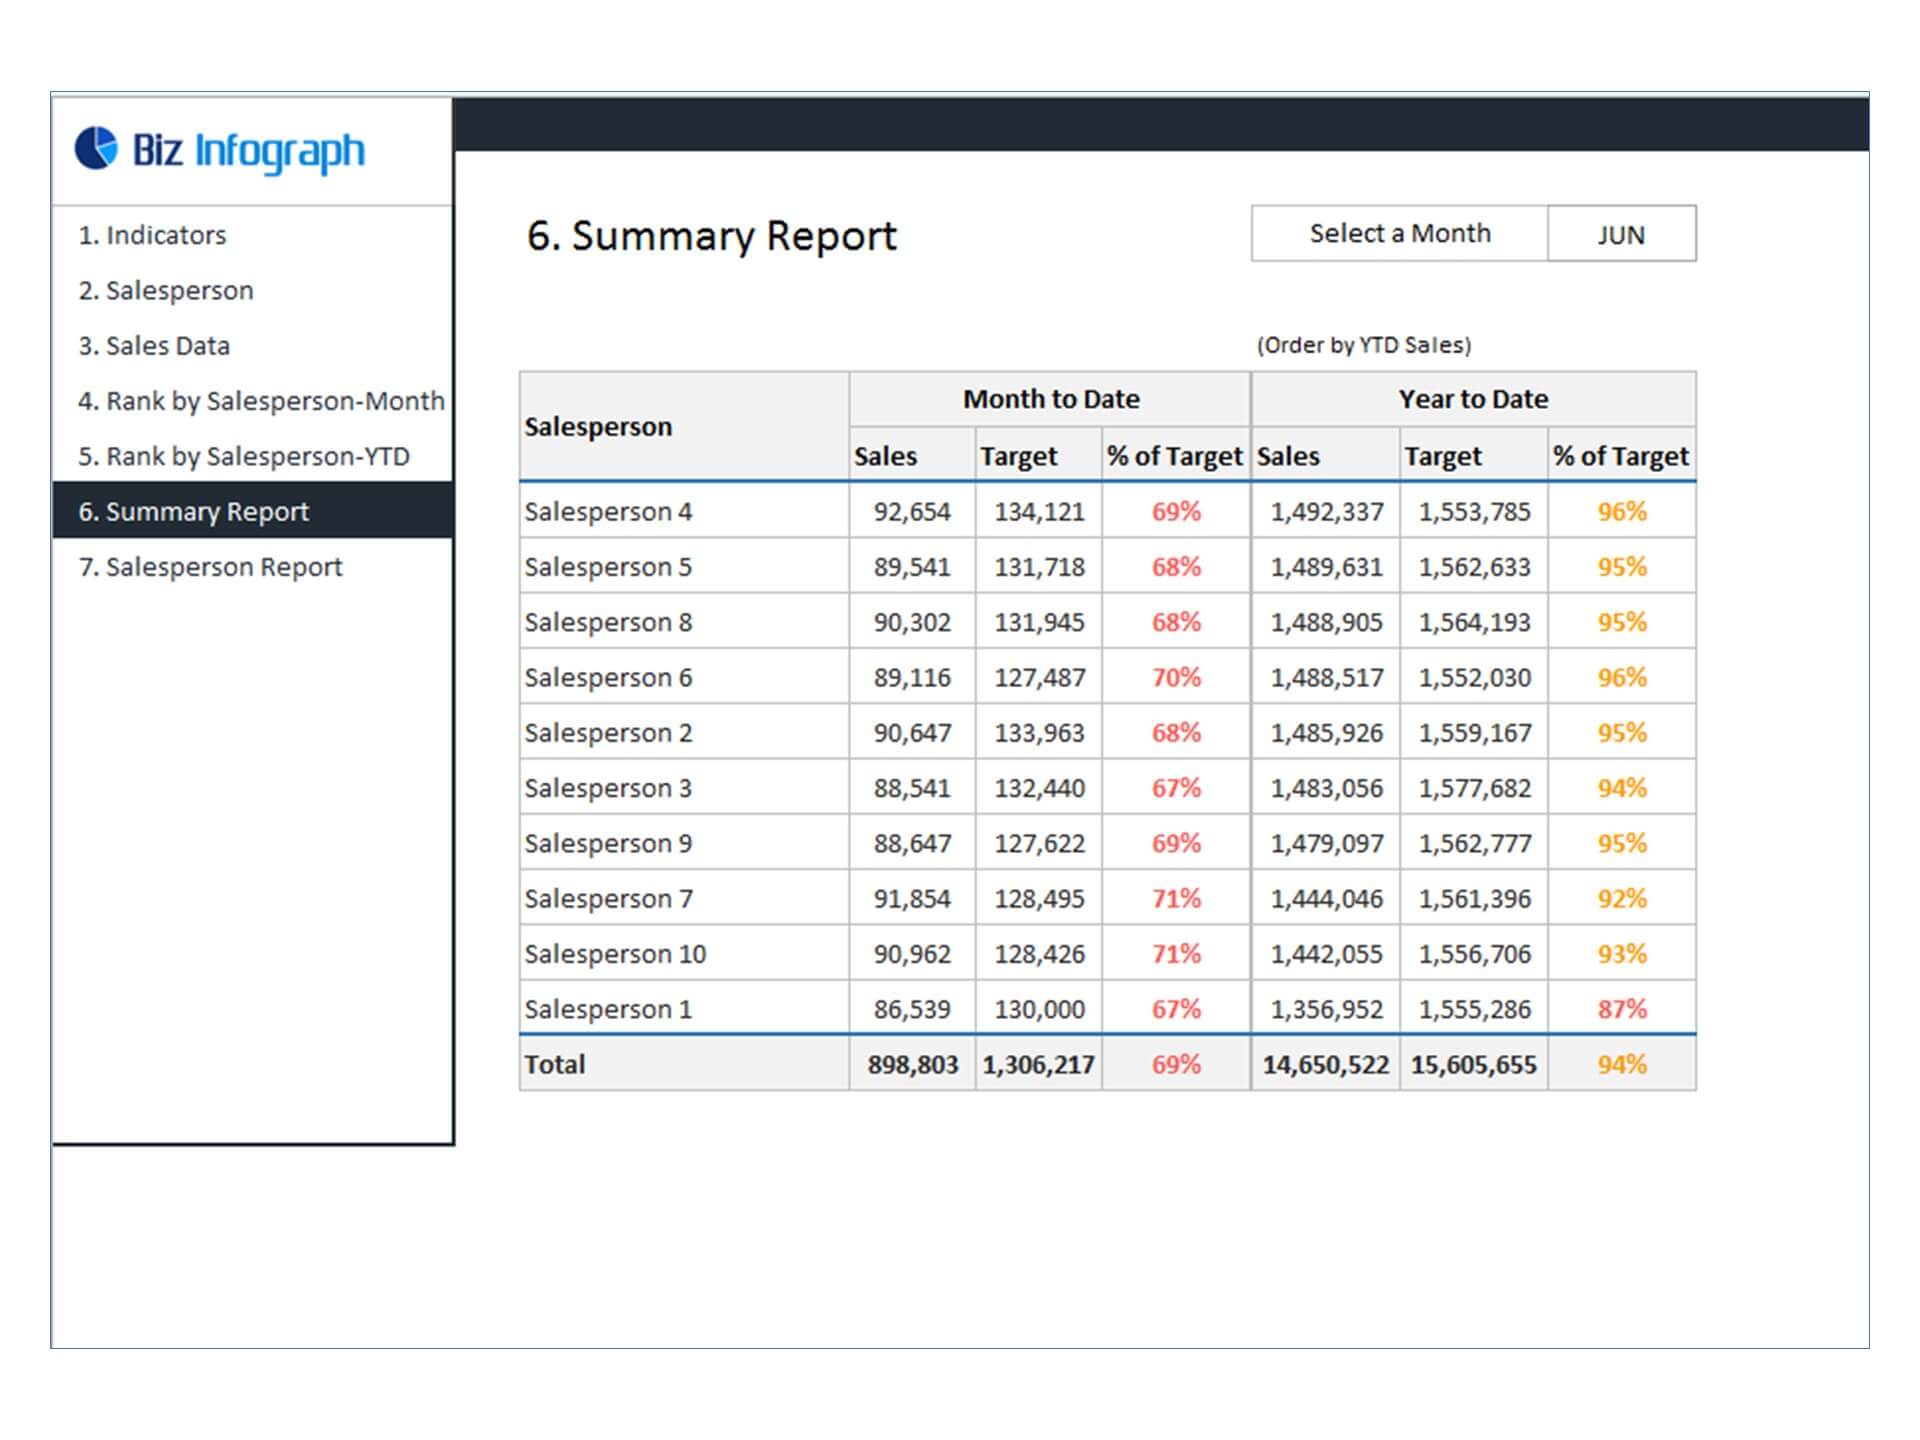
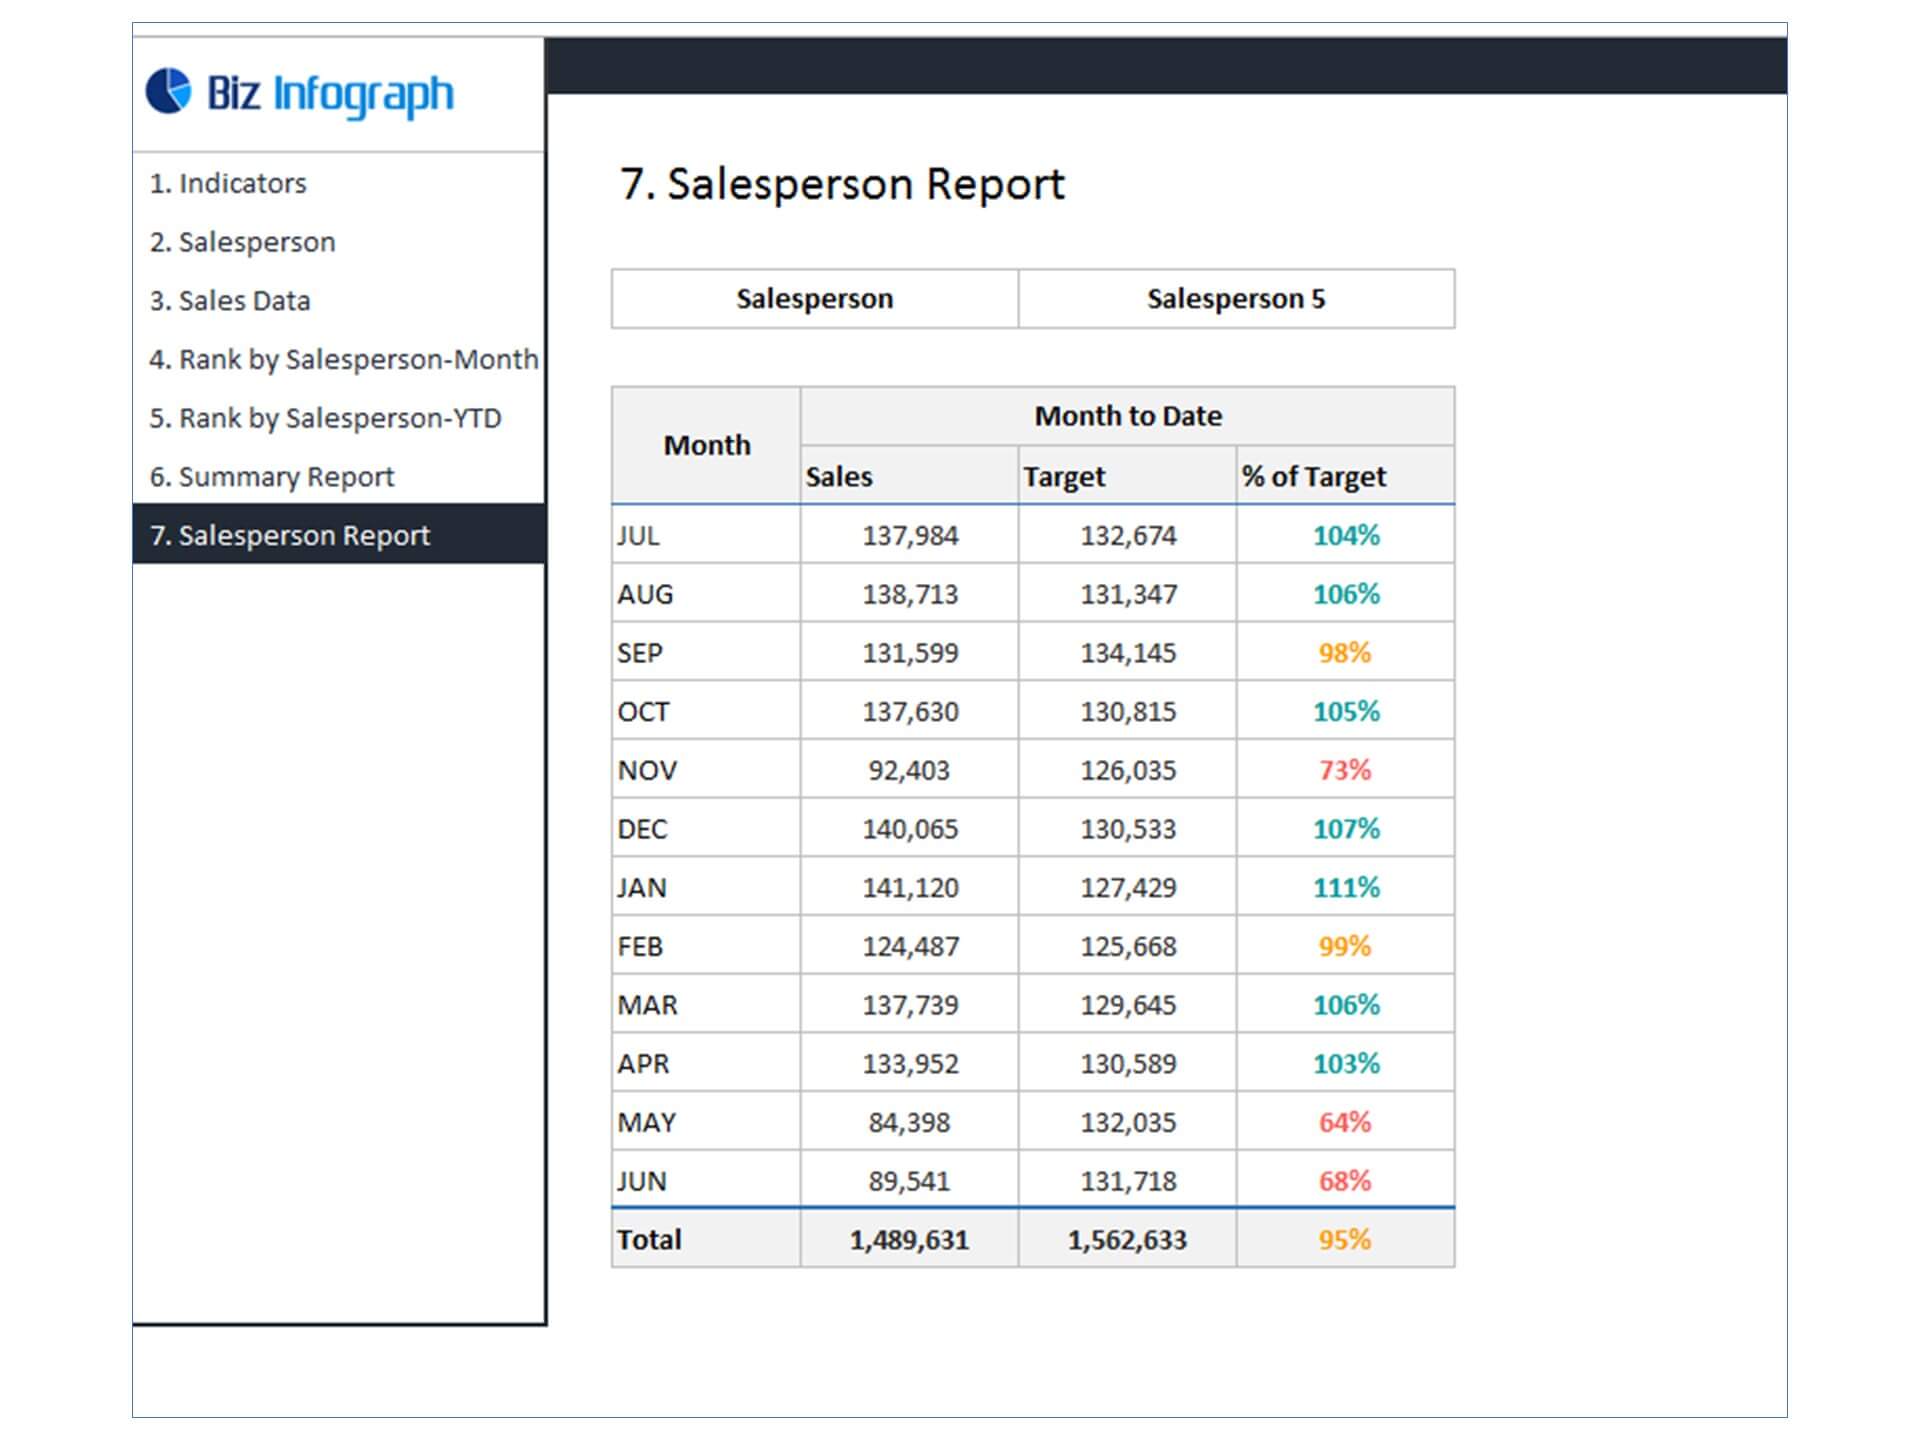
- Go to the ‘Monthly Dashboard’ menu – select the month name from the drop-down to see the monthly picture of performance indicators
- Go to ‘YTD Dashboard’ menu - select month name from the drop-down to see the year-to-date picture of performance indicators
- Each page is ready for printing – just press CTRL+P
This Excel dashboard template is password-protected to avoid mistakes, such as accidentally deleting formulas. When you completed the purchase, the password will be available.