Sales Pipeline Dashboard is an Excel Template that will help to manage your sales in various dimensions. This template is designed to see your overall sales pipeline stages and expected amount of sales to realize.
Sales Pipeline Dashboard template depicts a visual representation of sales results in order to boost performance, create accountability and monitor progresses. The data-driven process assists to take a judicious decision. Sales Pipeline Dashboard template allows you to track sales based on different stages of sales.
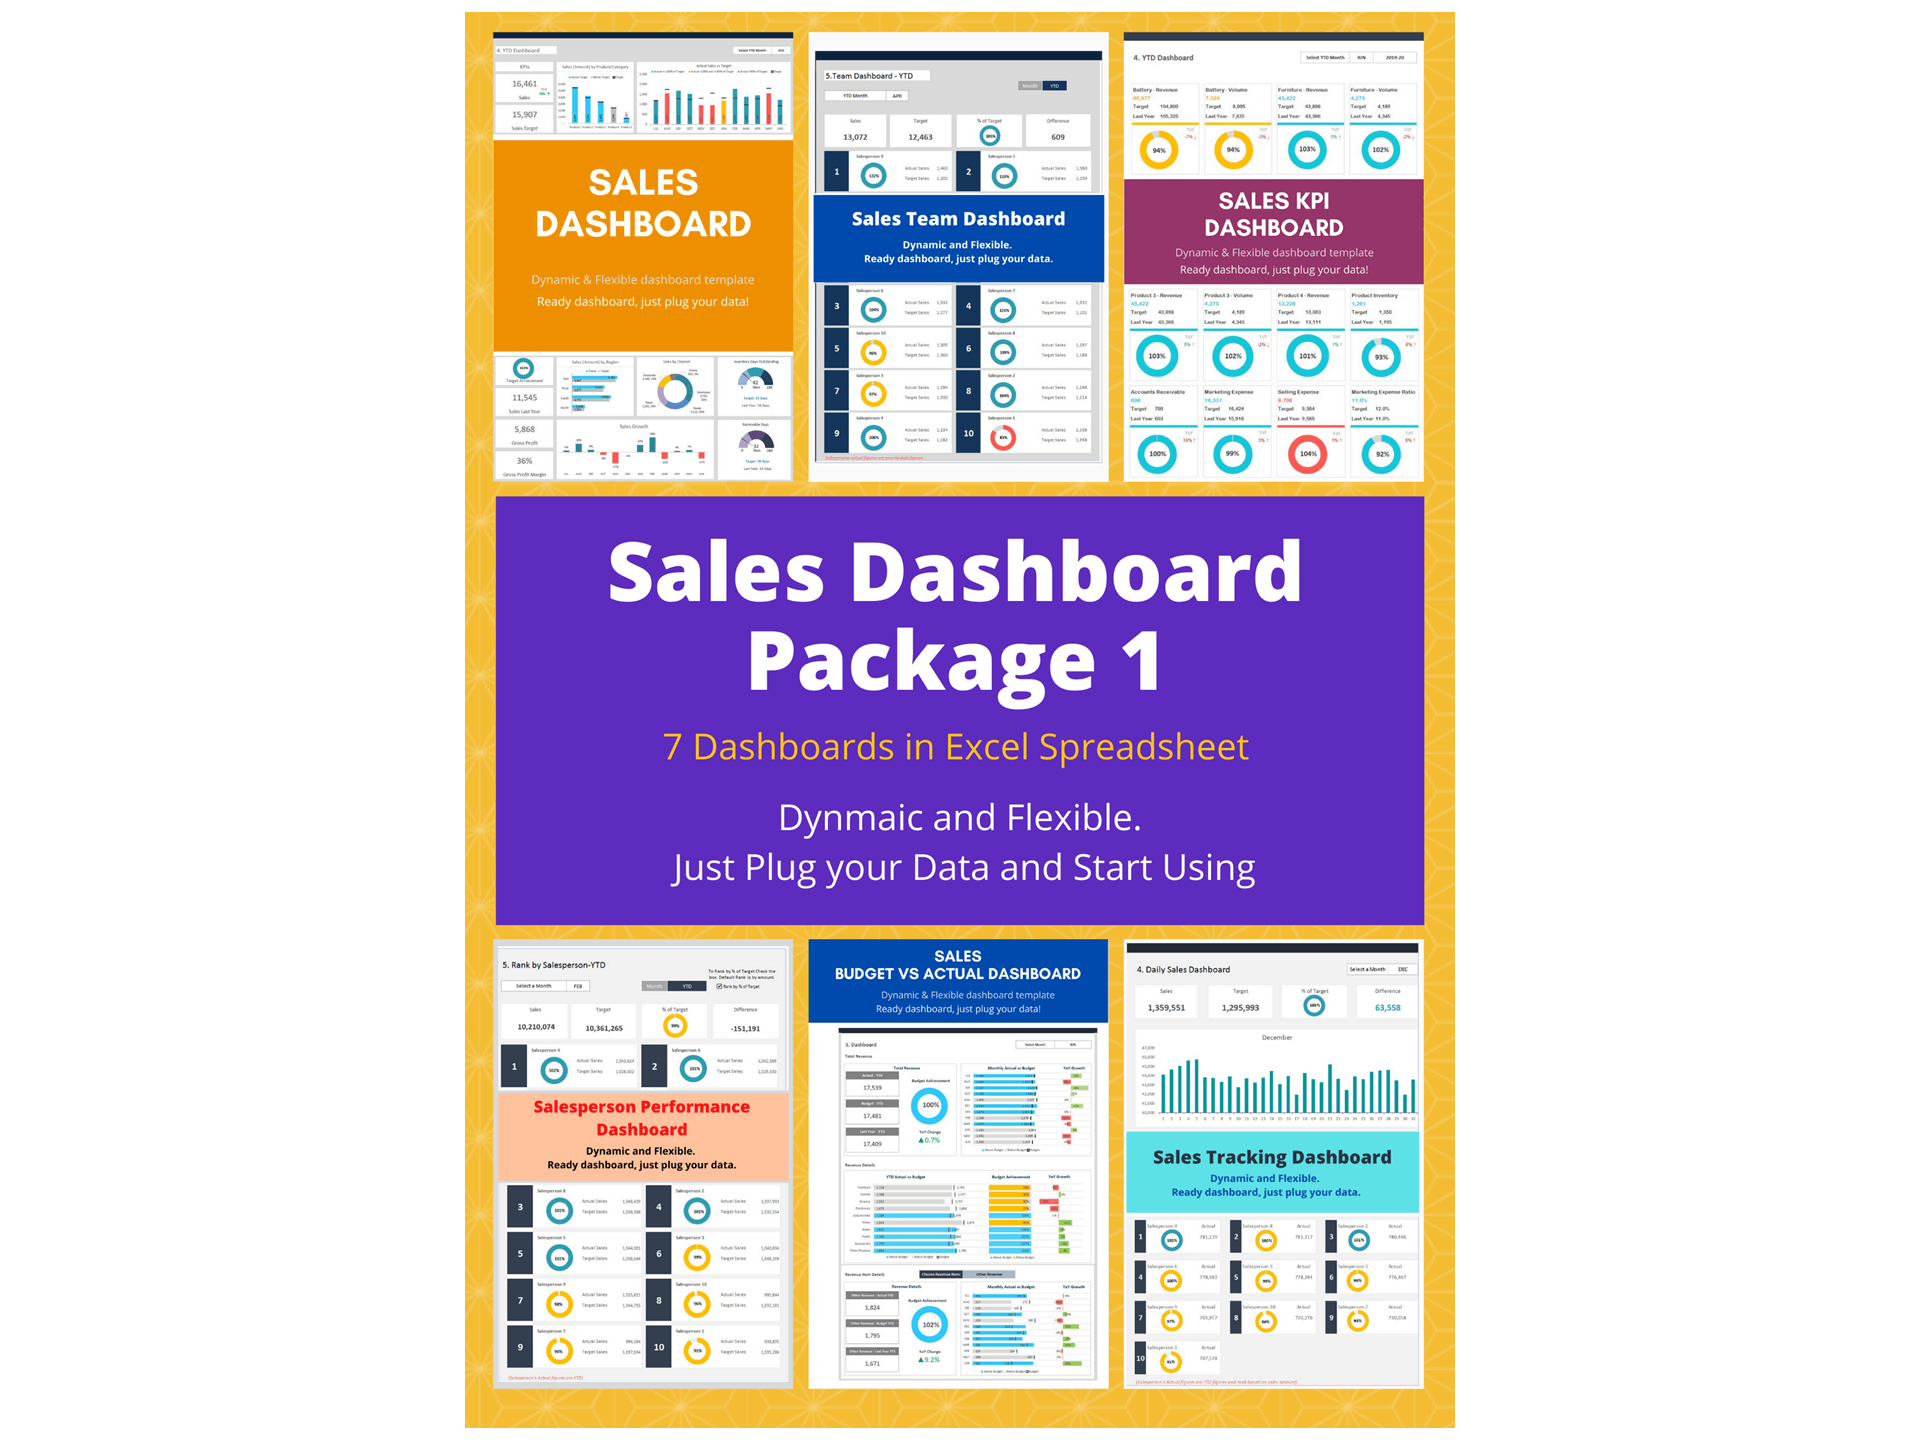
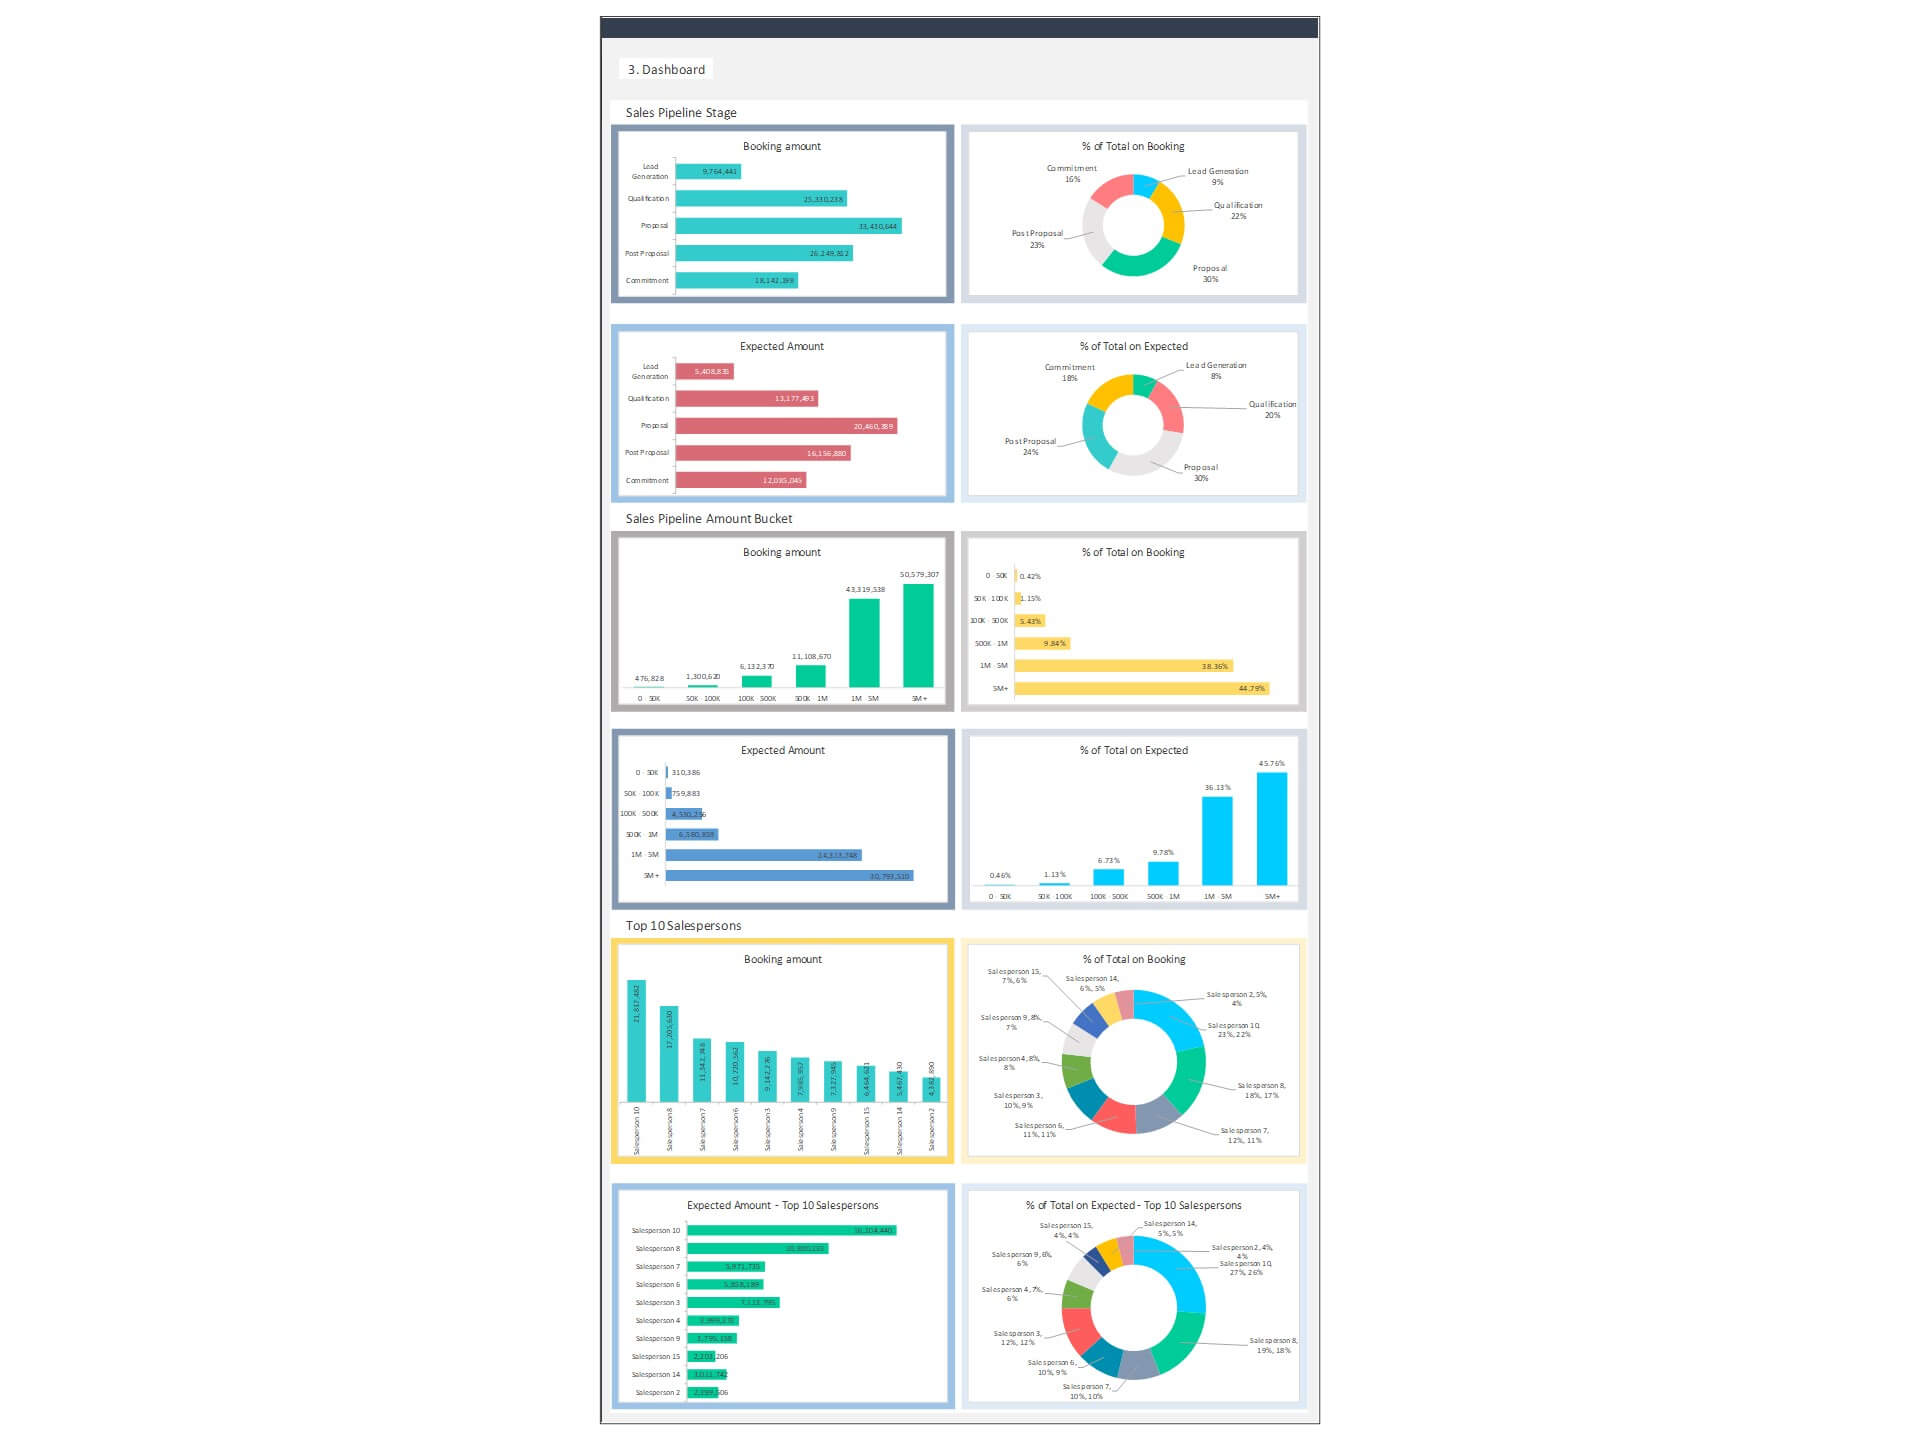
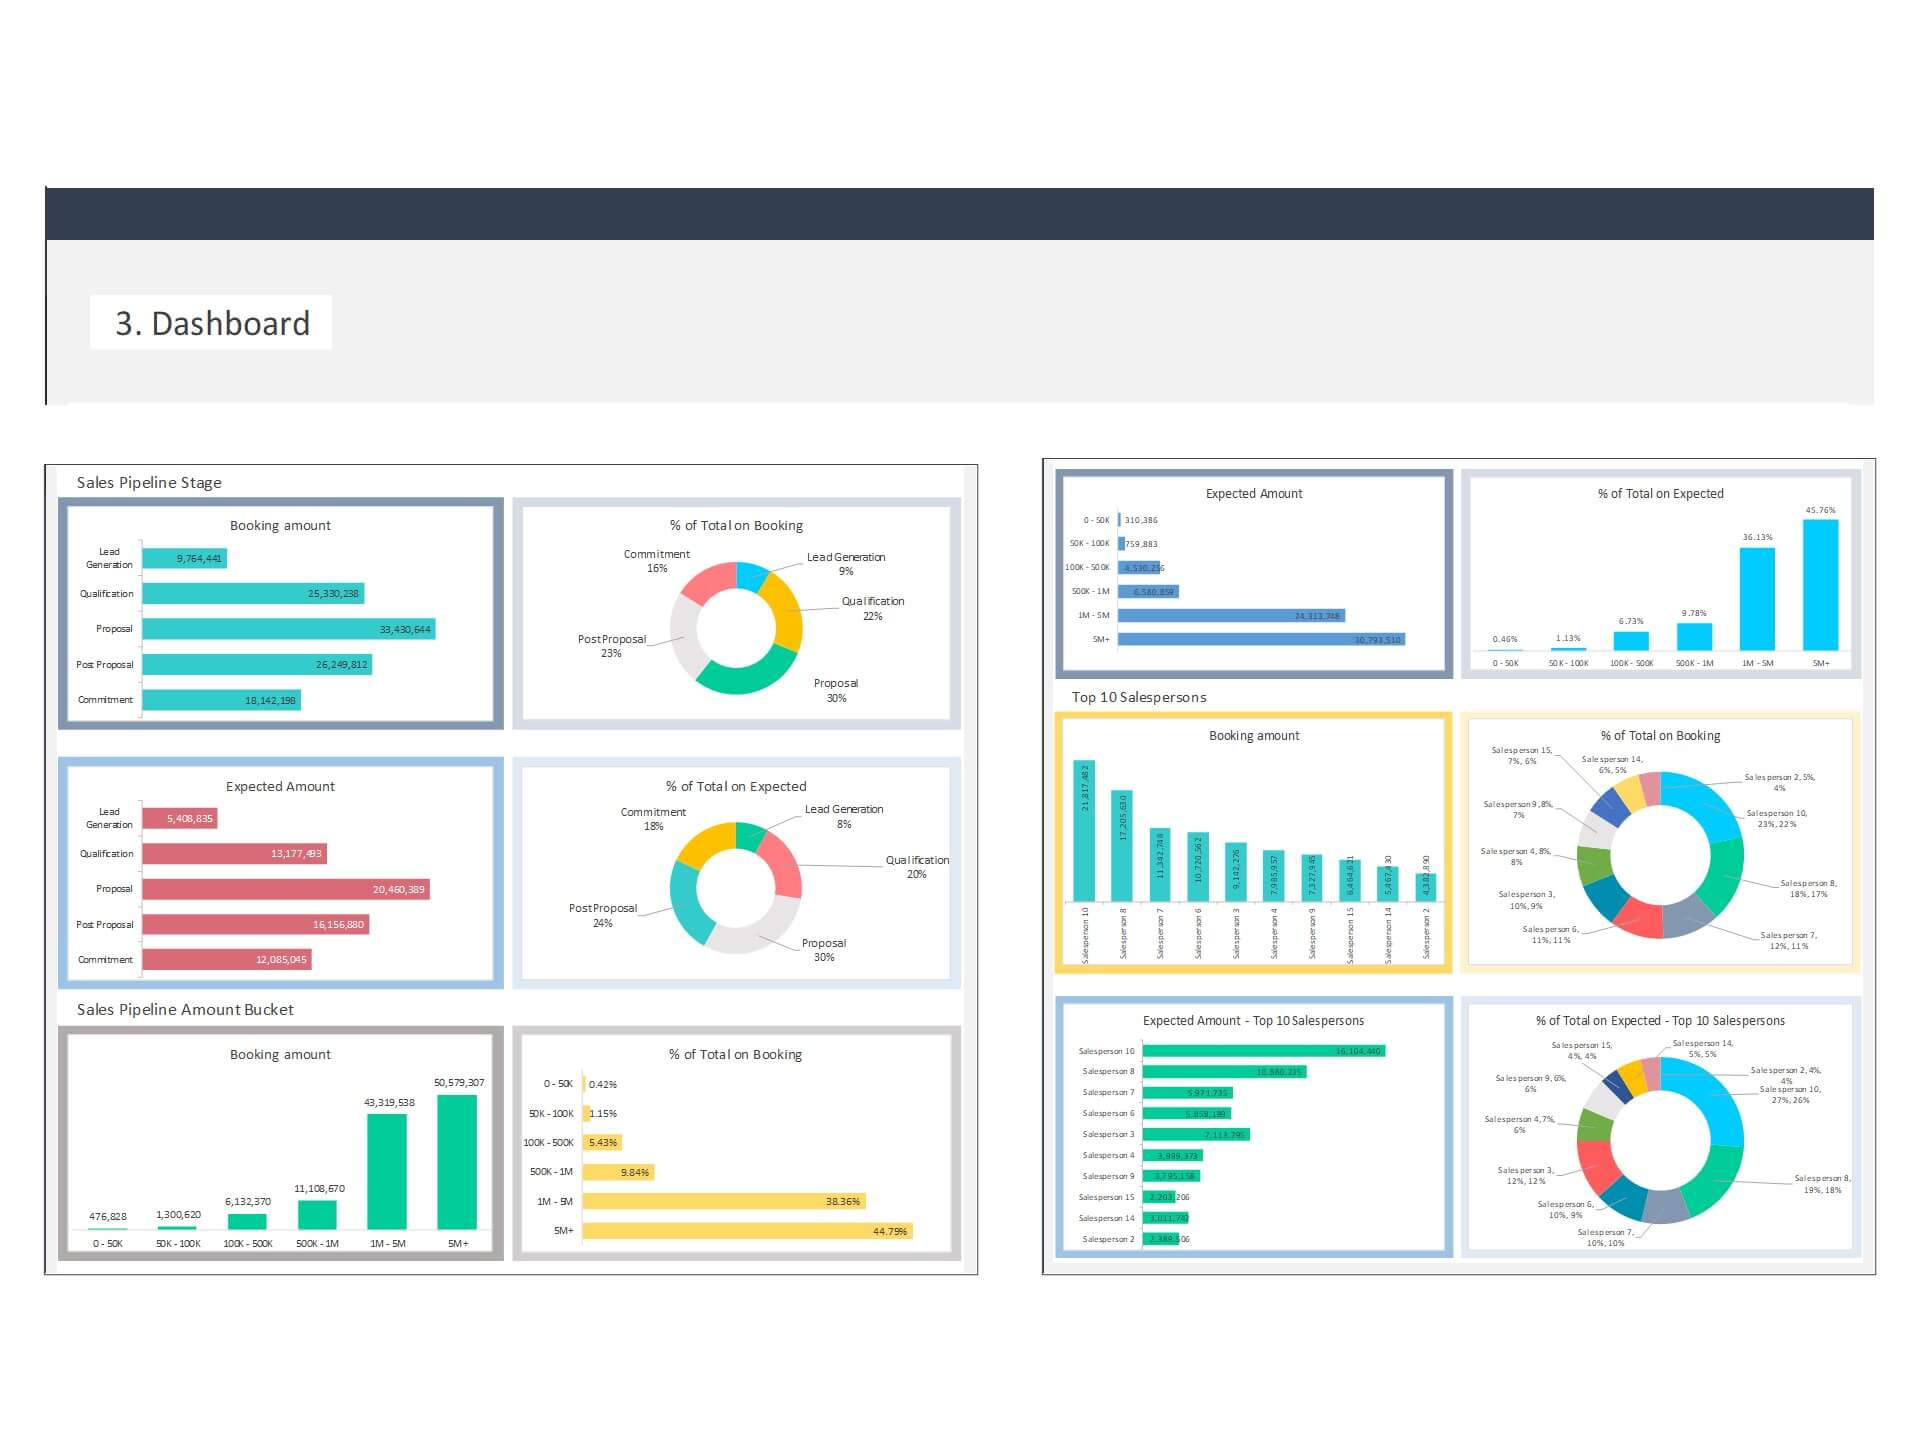
Key Features of Dashboard Template:
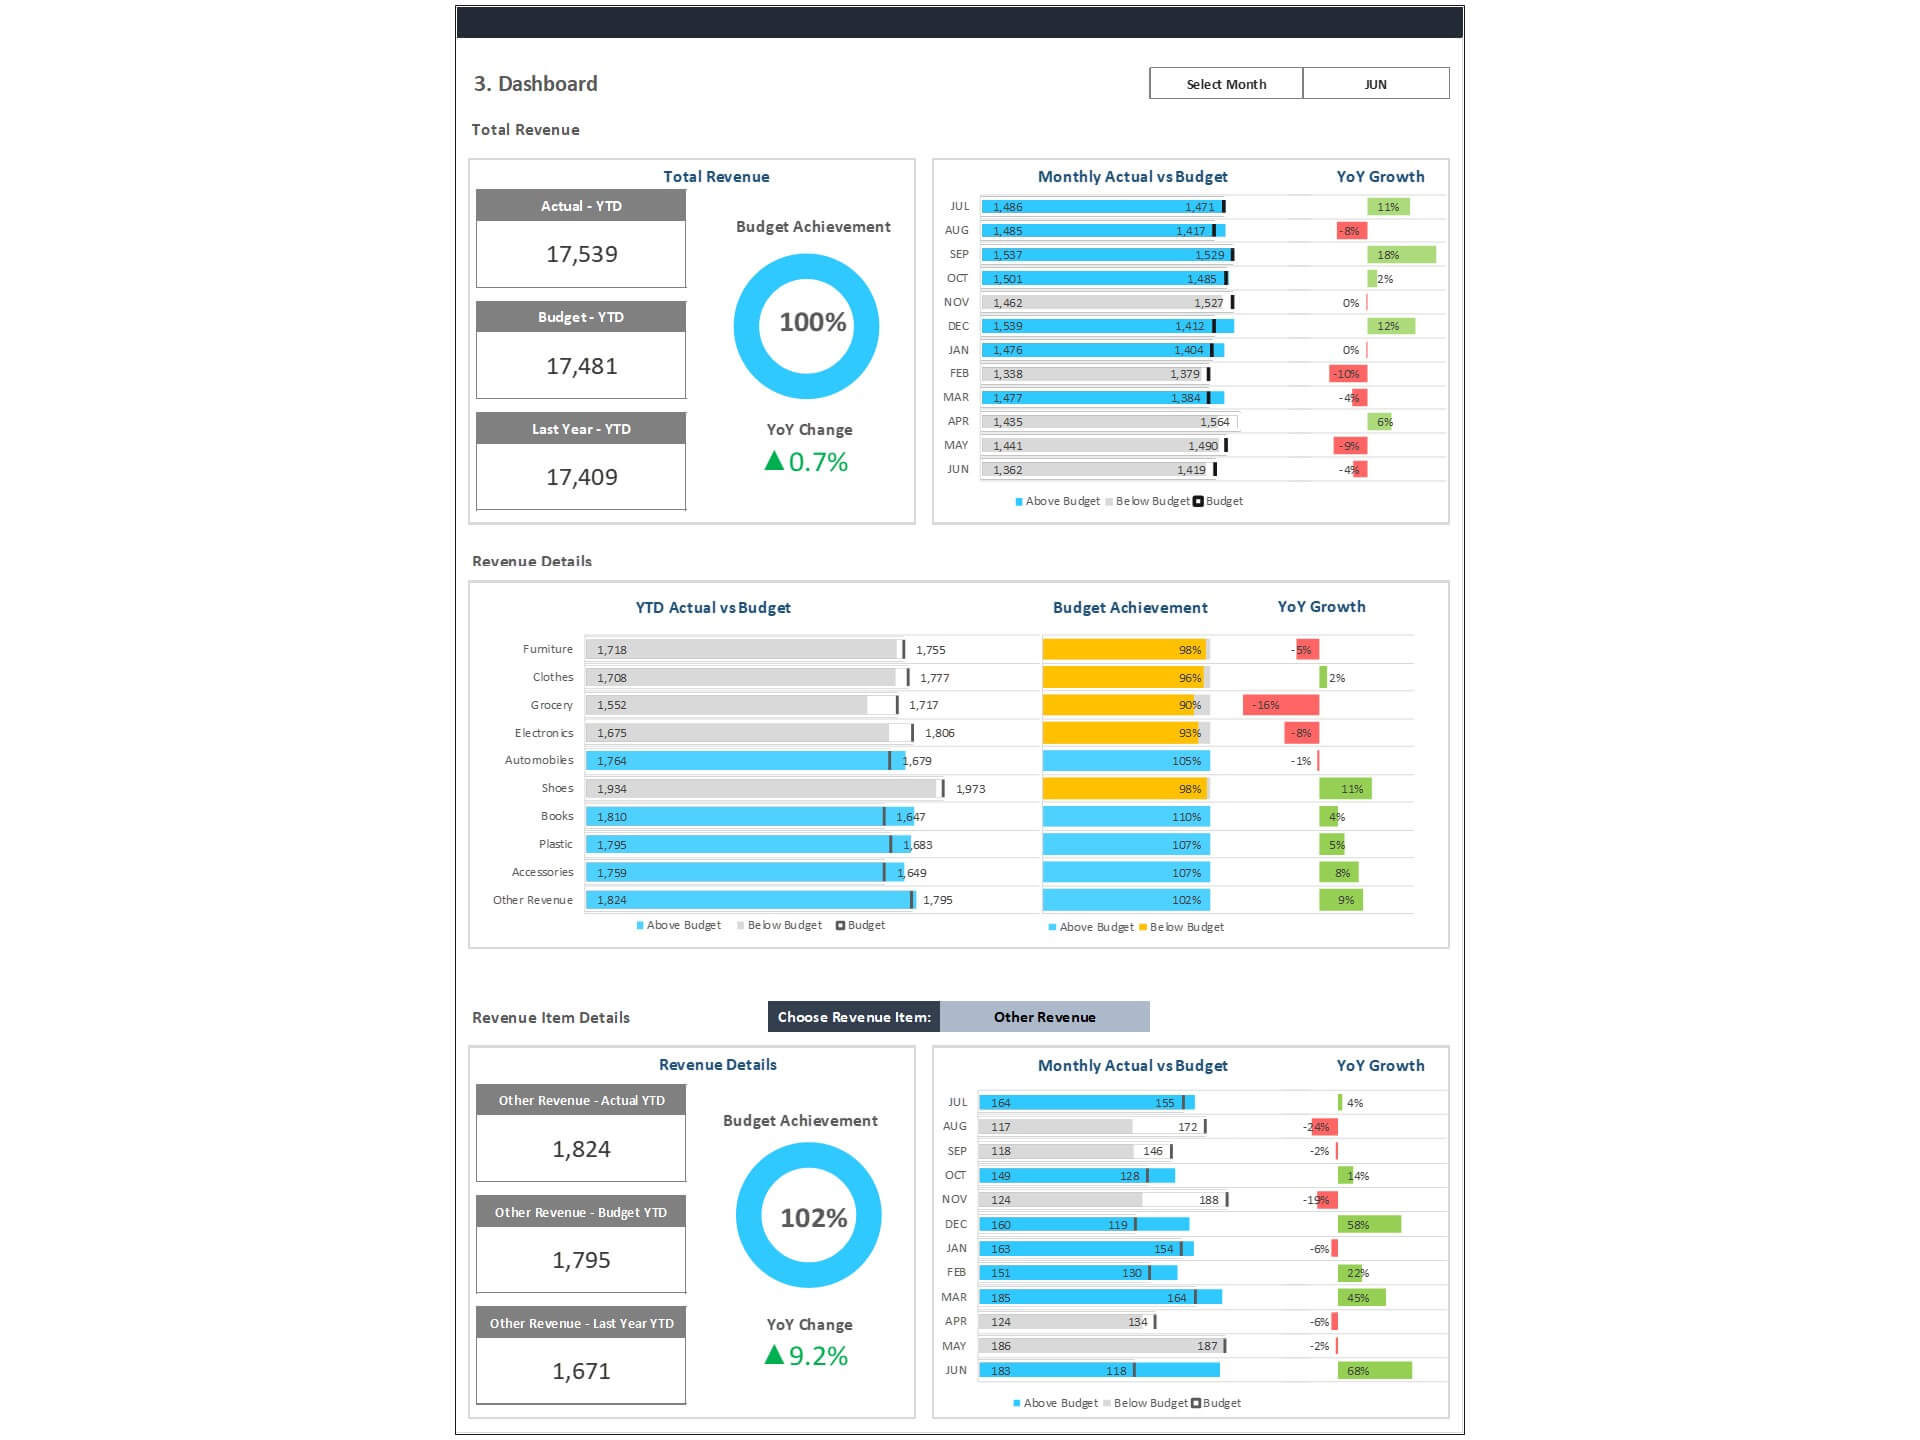
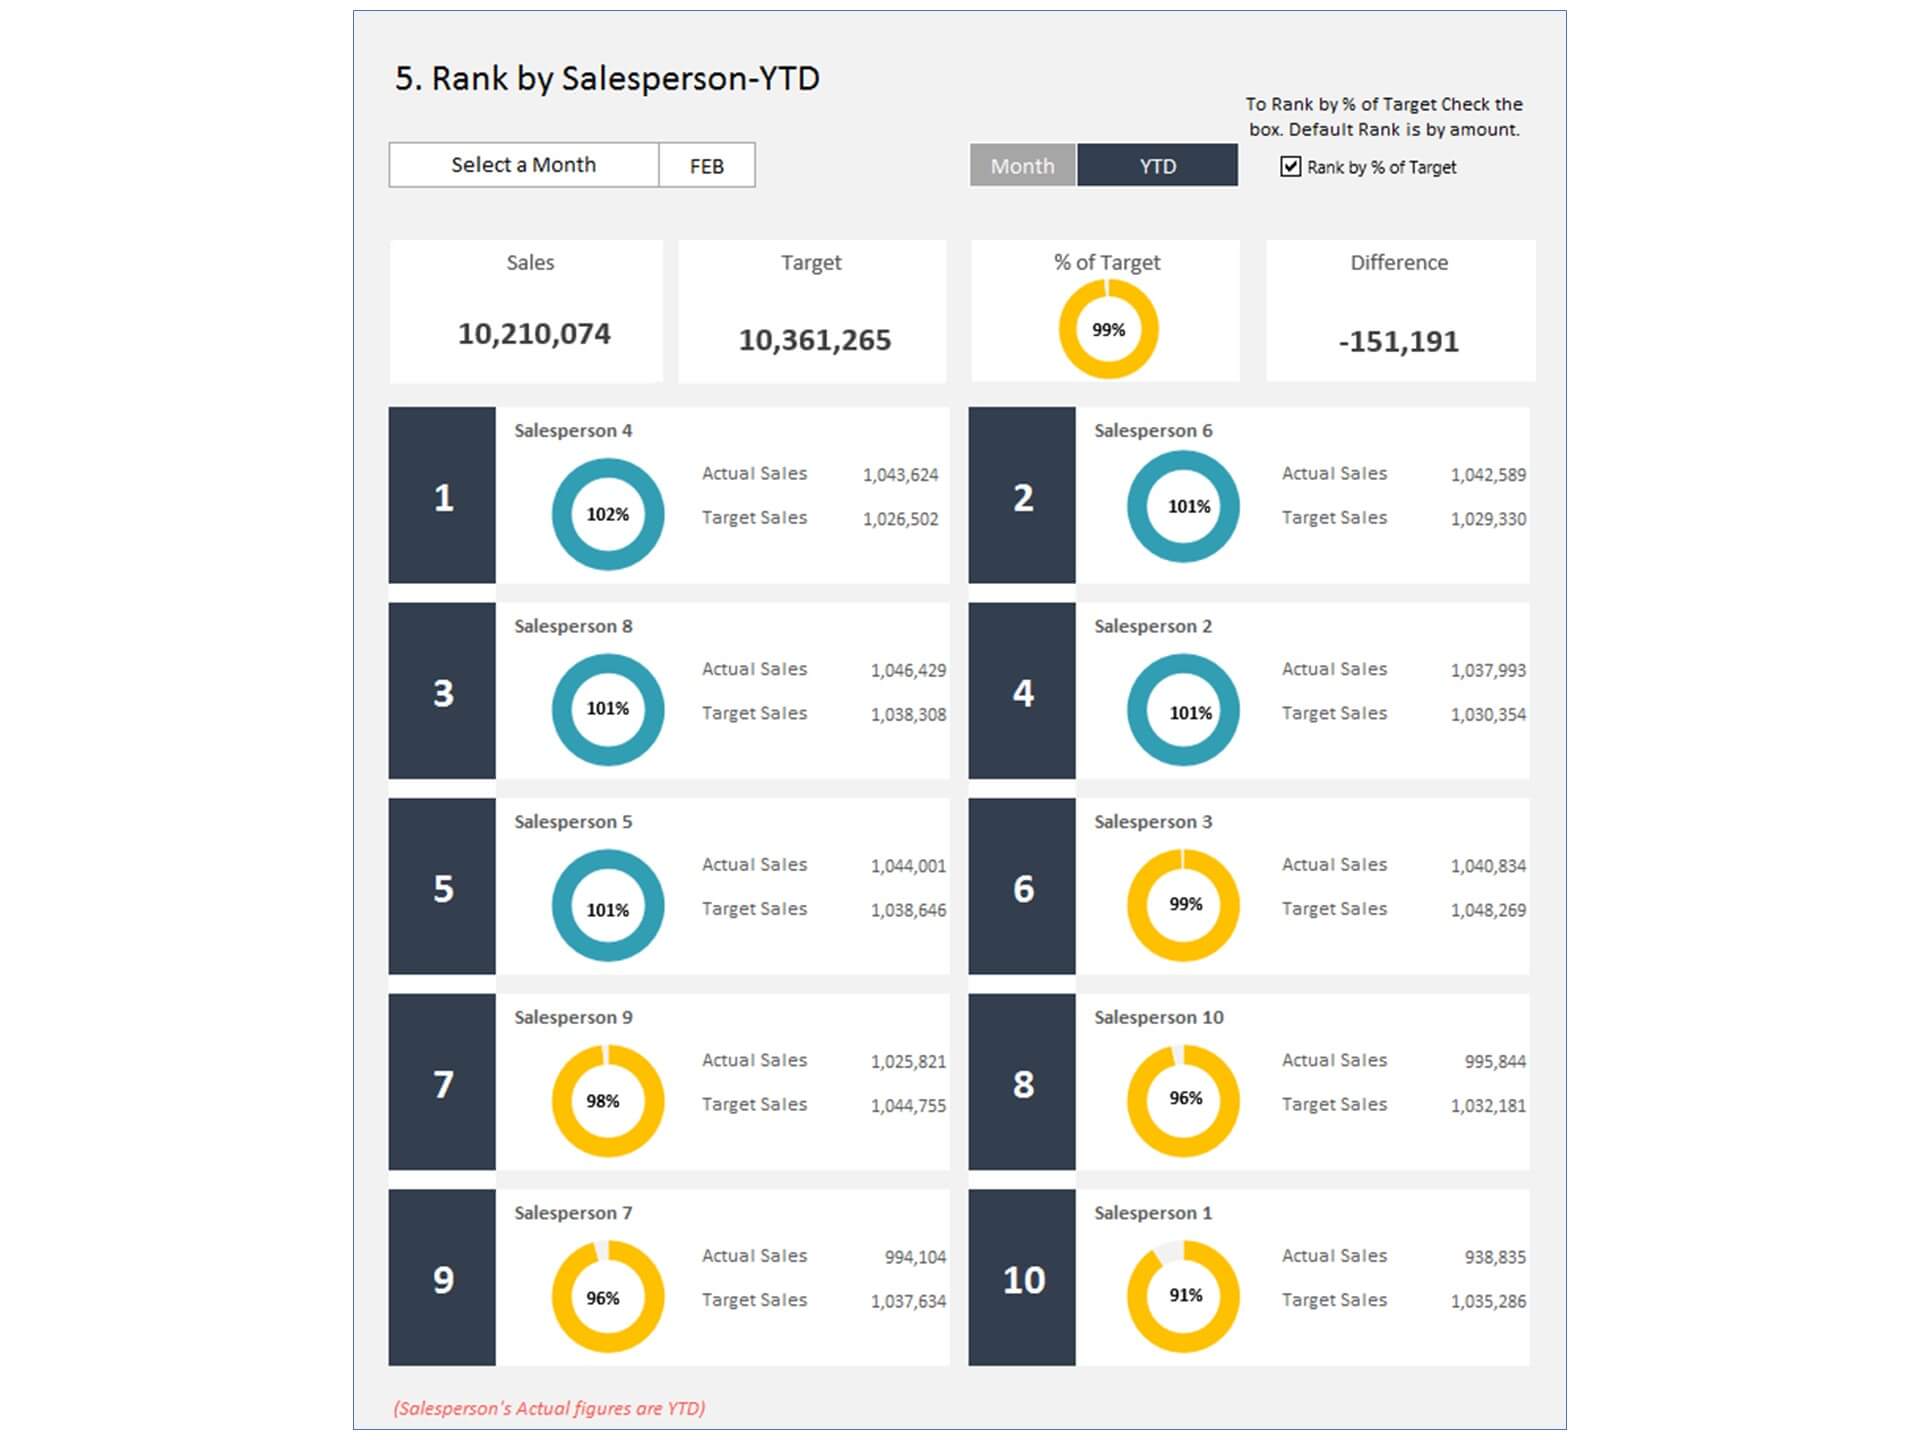
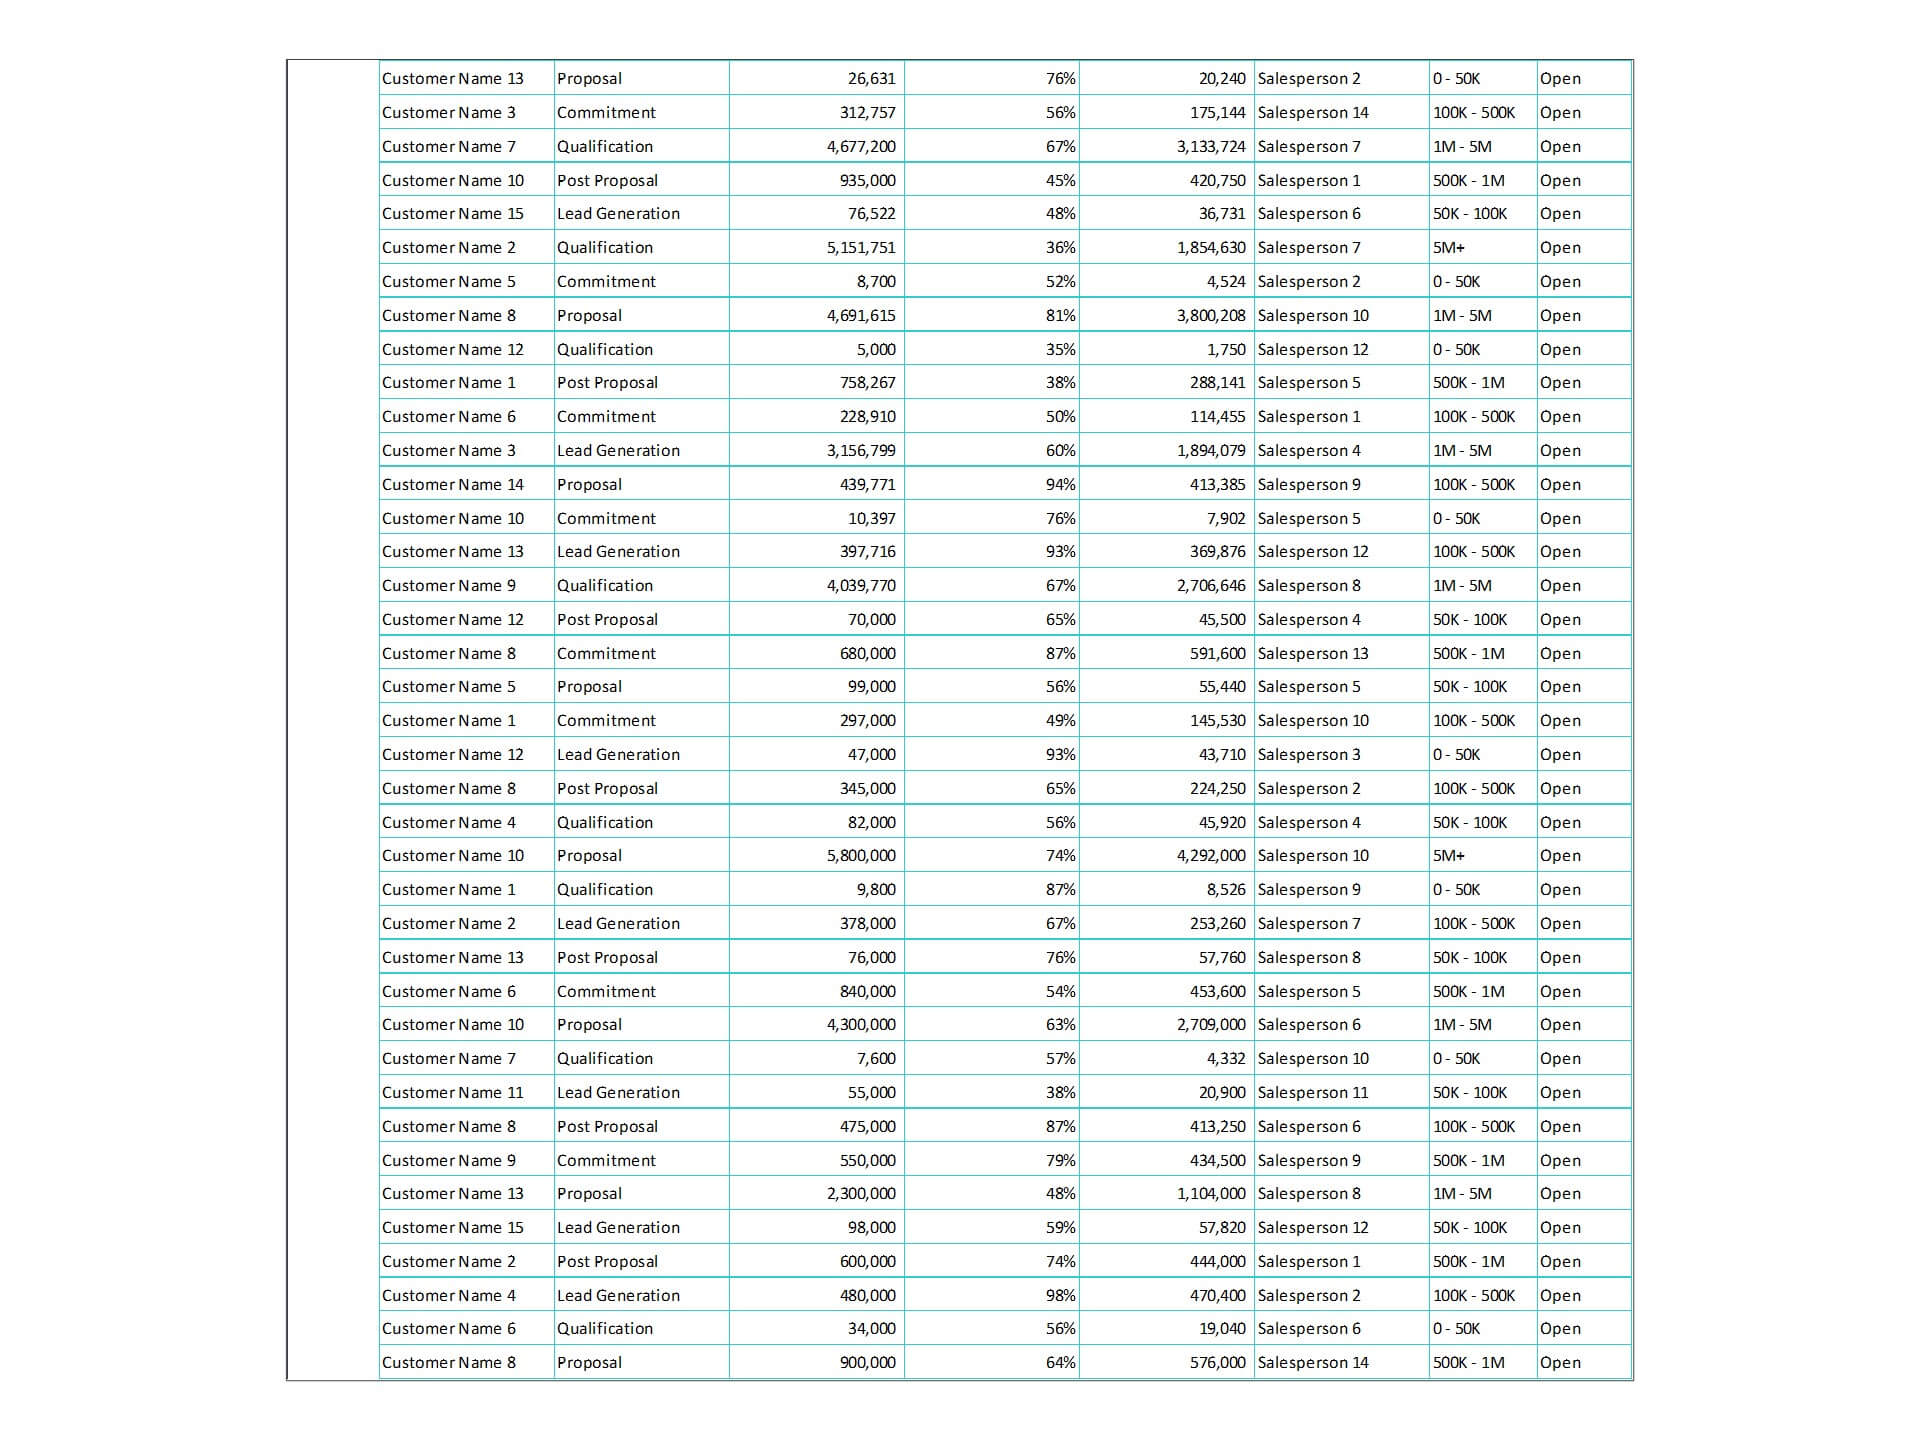
- Provides key sales insights for the CEO and sales team with details of total sales in pipeline i.e. Lead Generation, Qualification, Proposal, Post Proposal and Commitment.
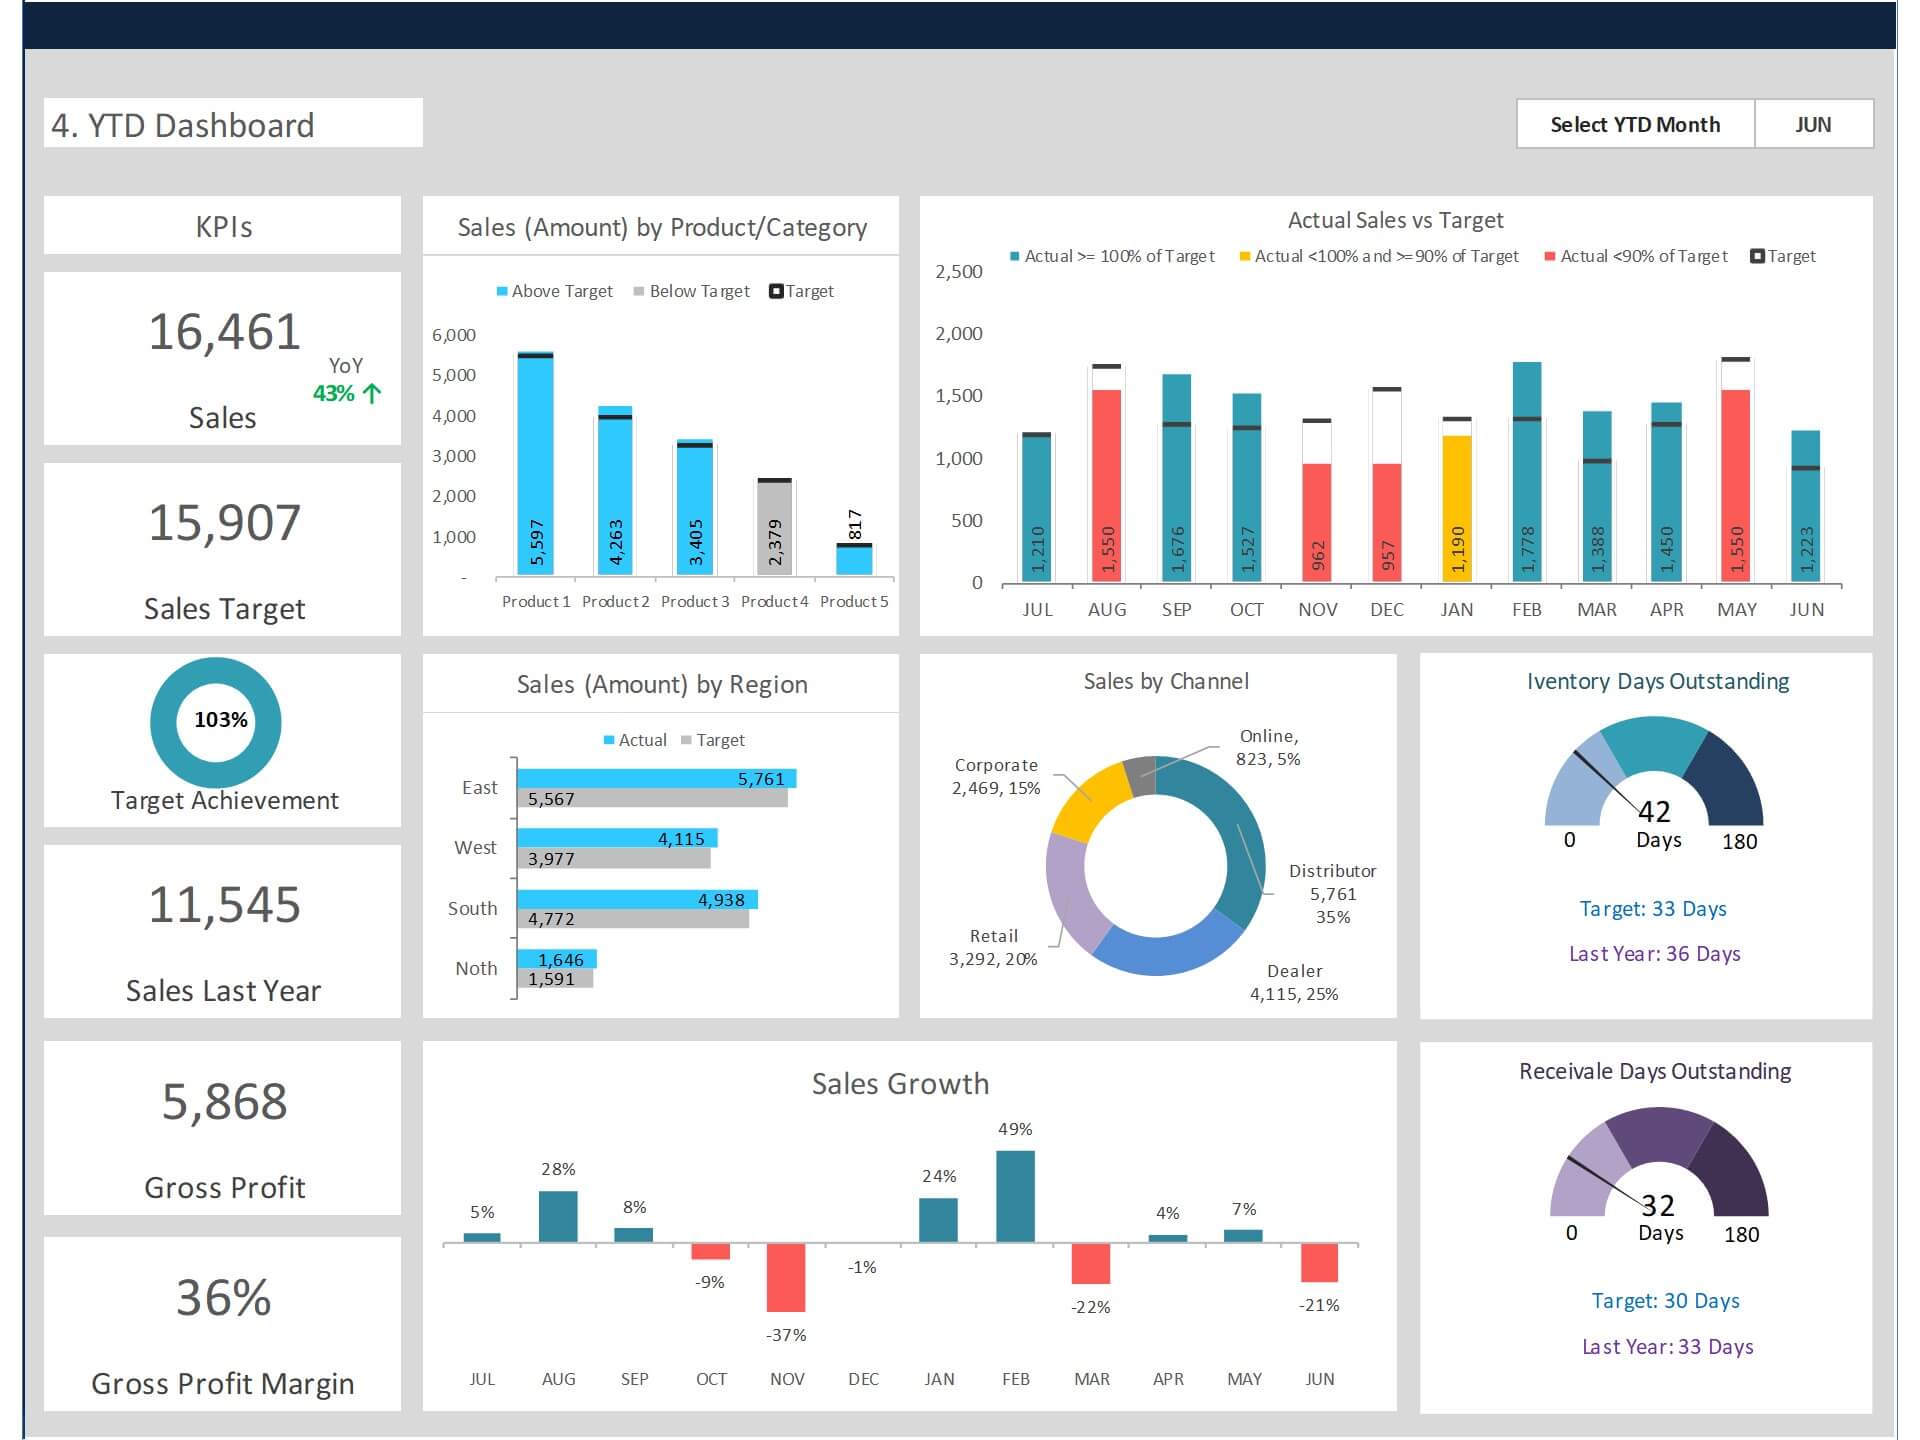
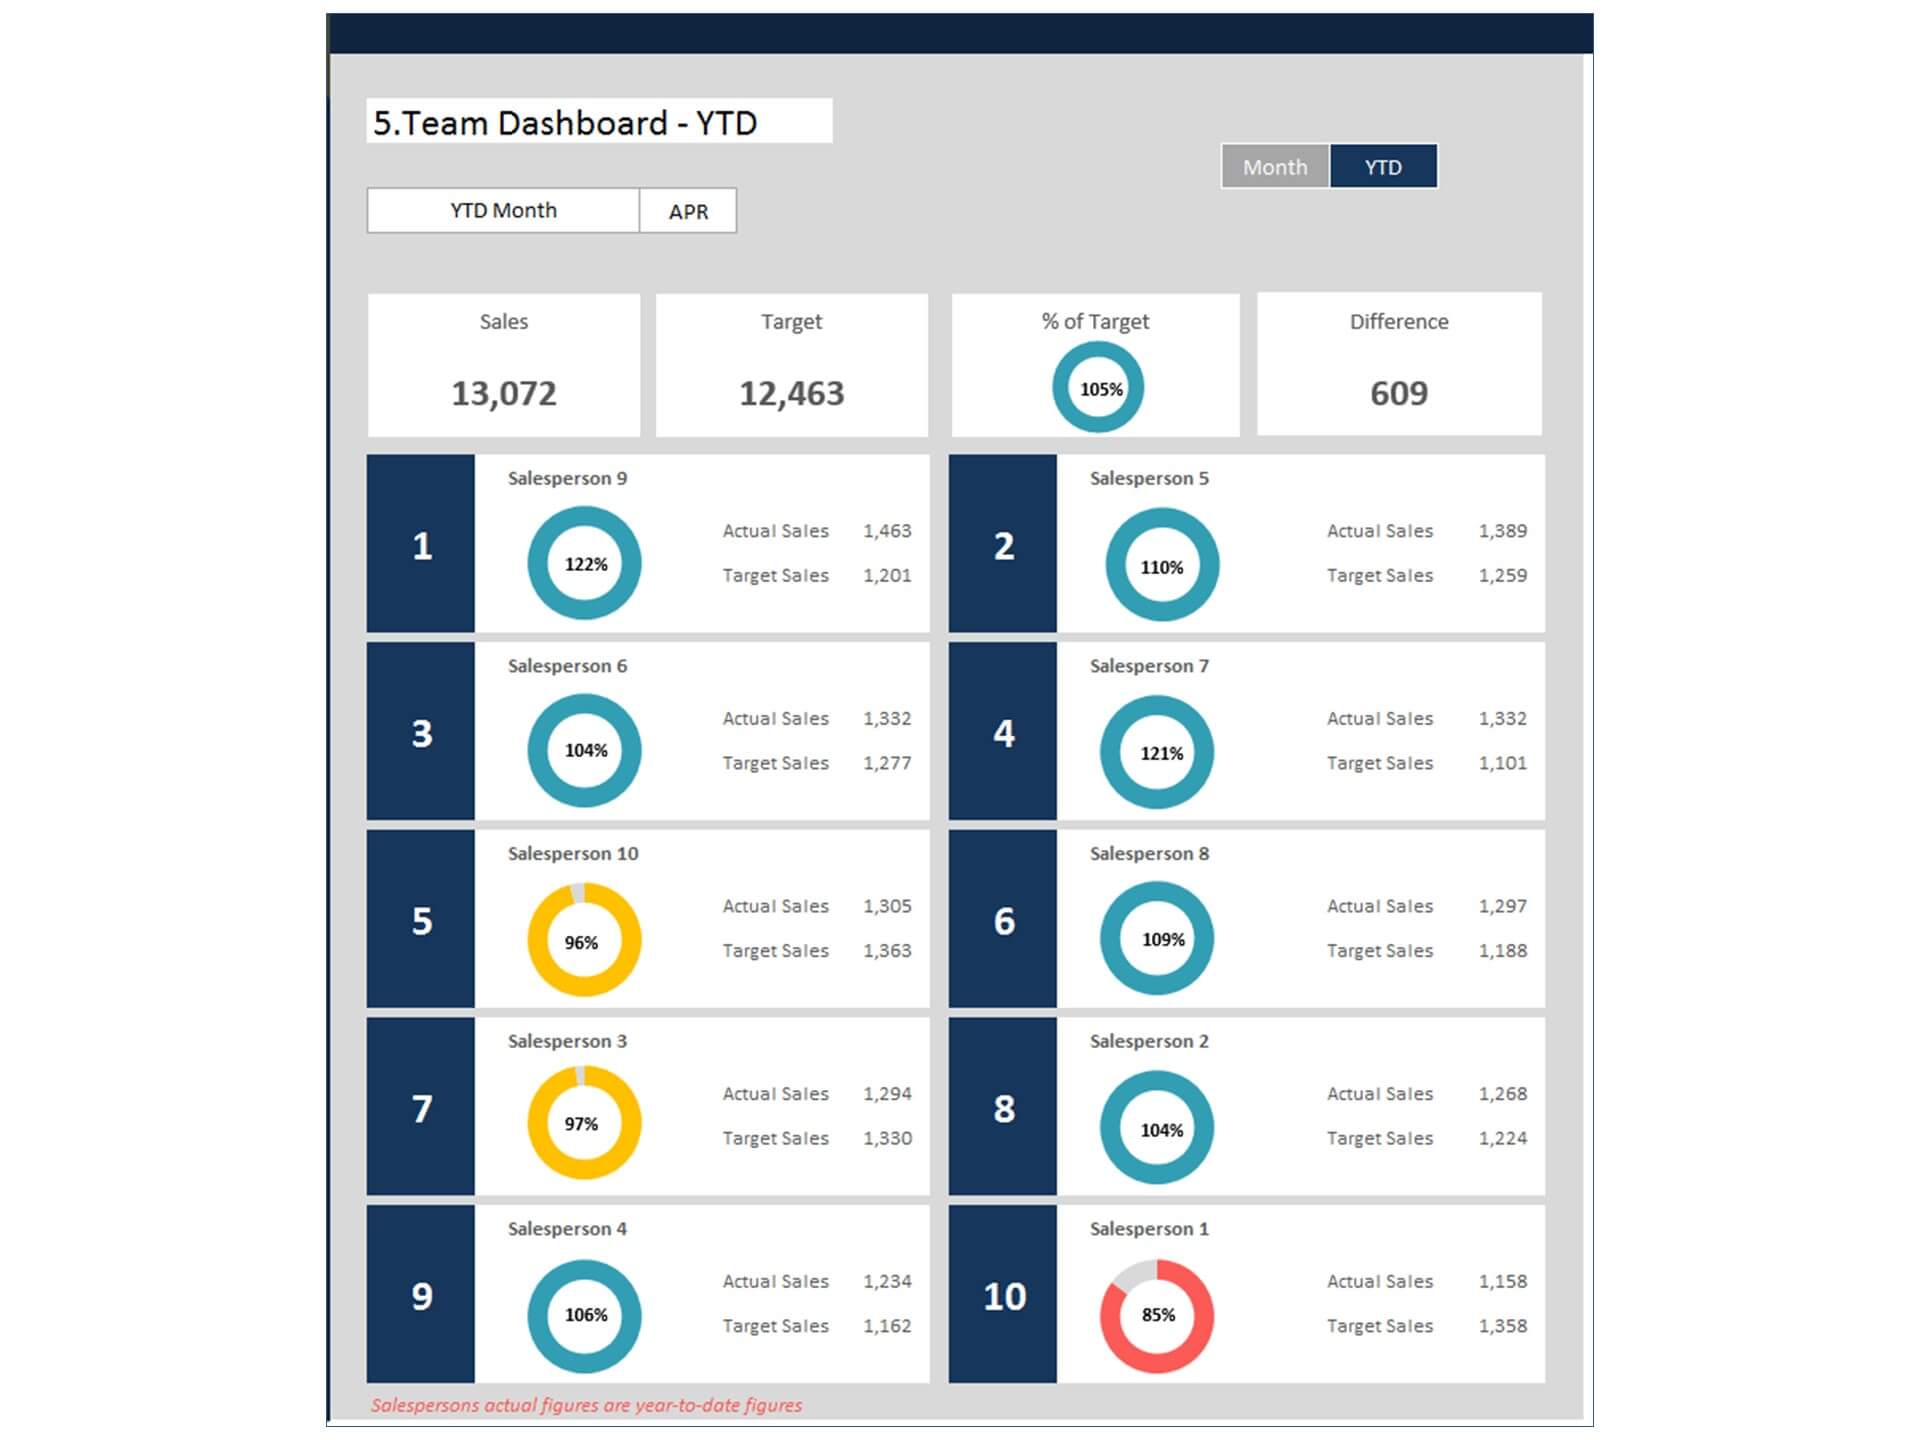
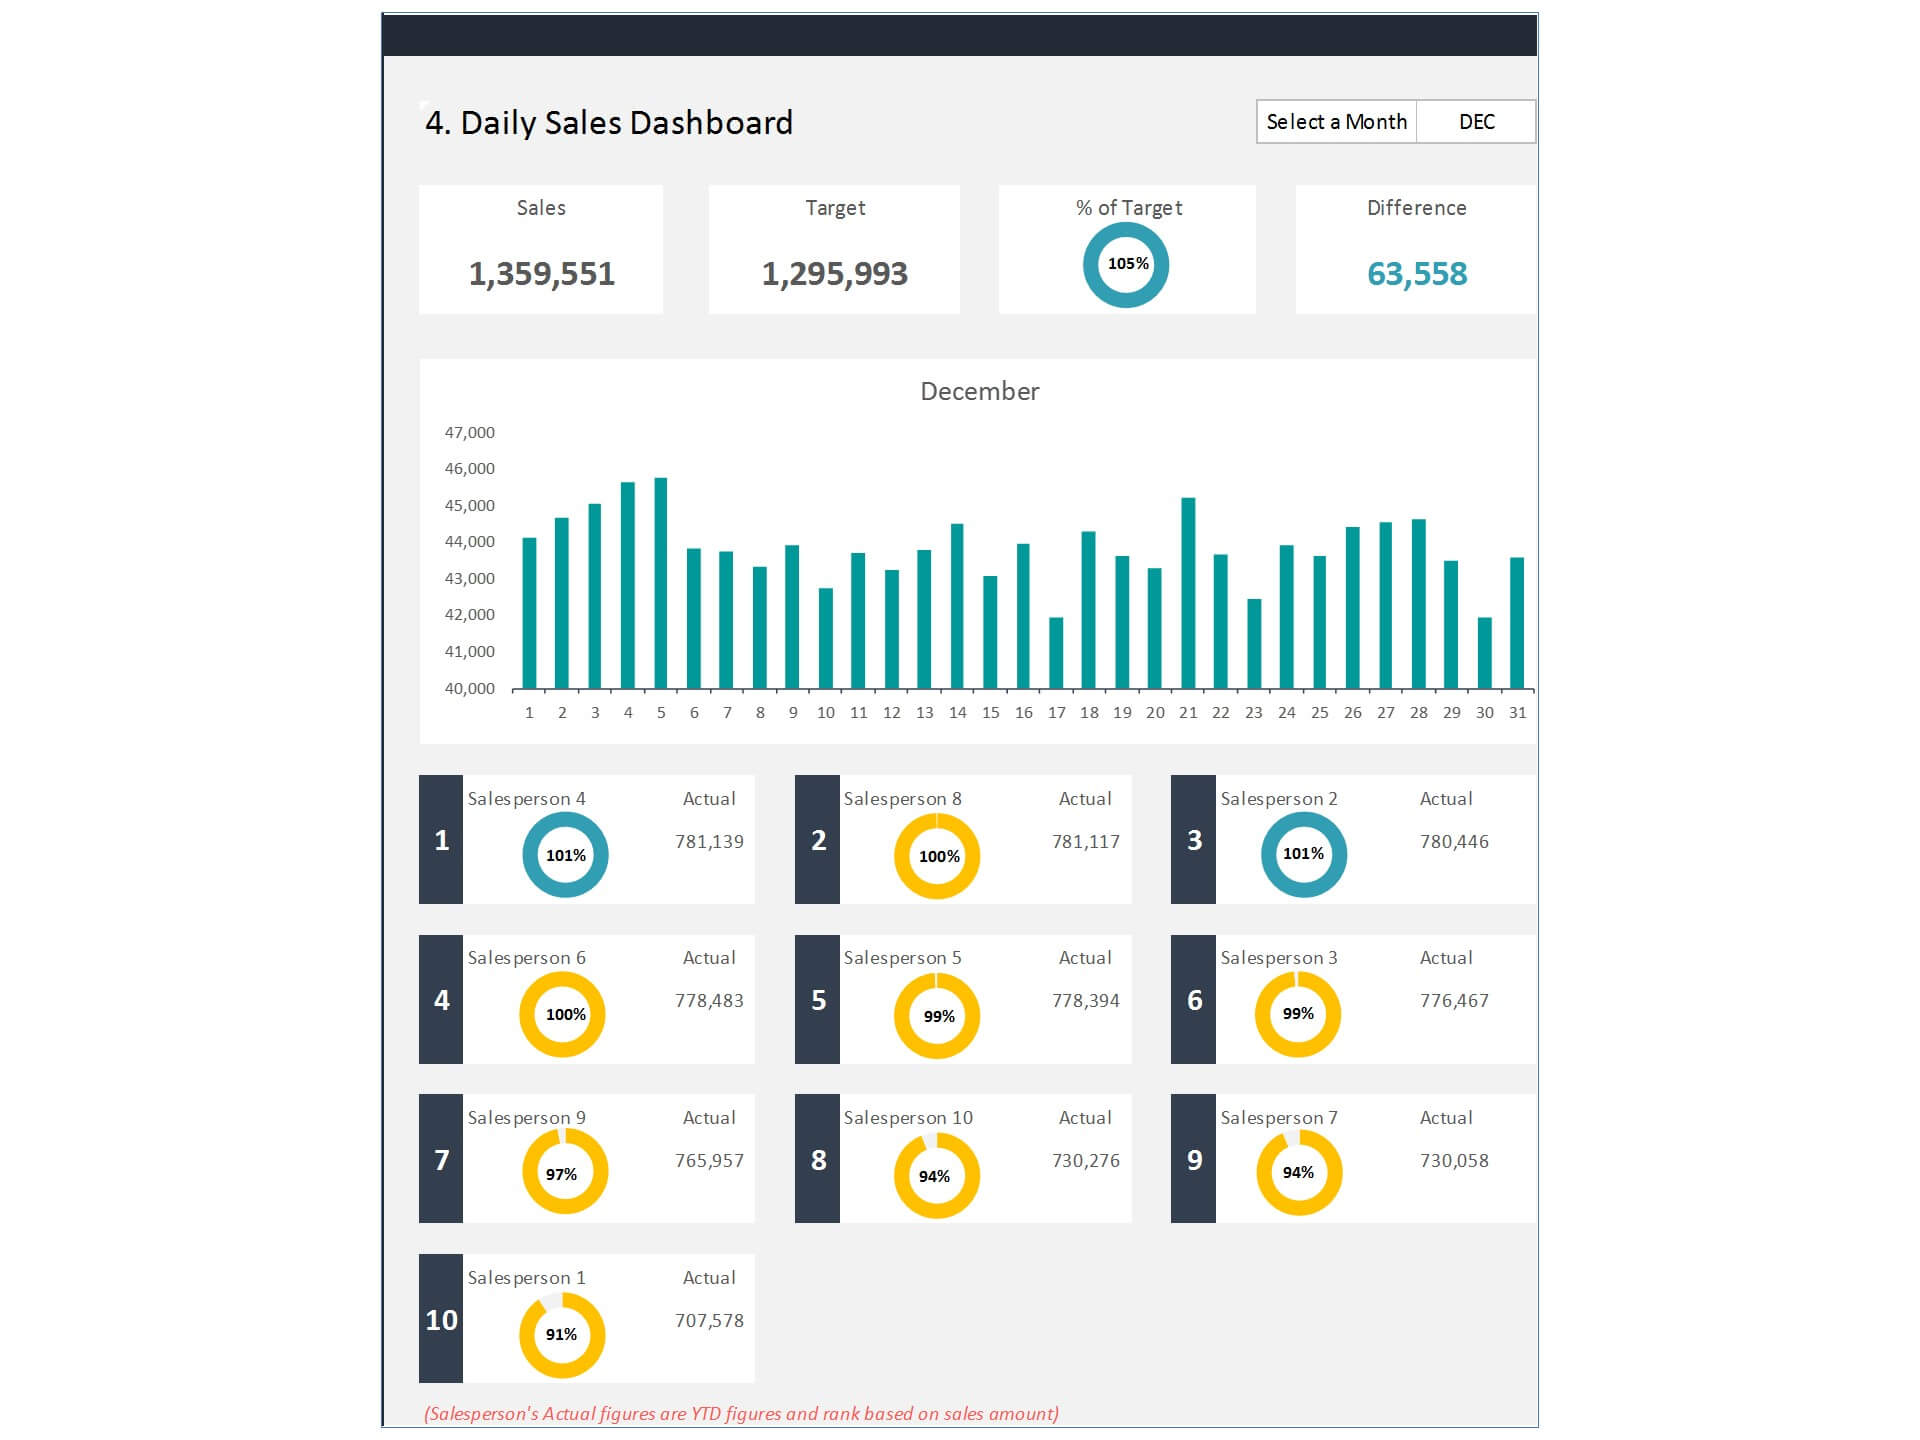
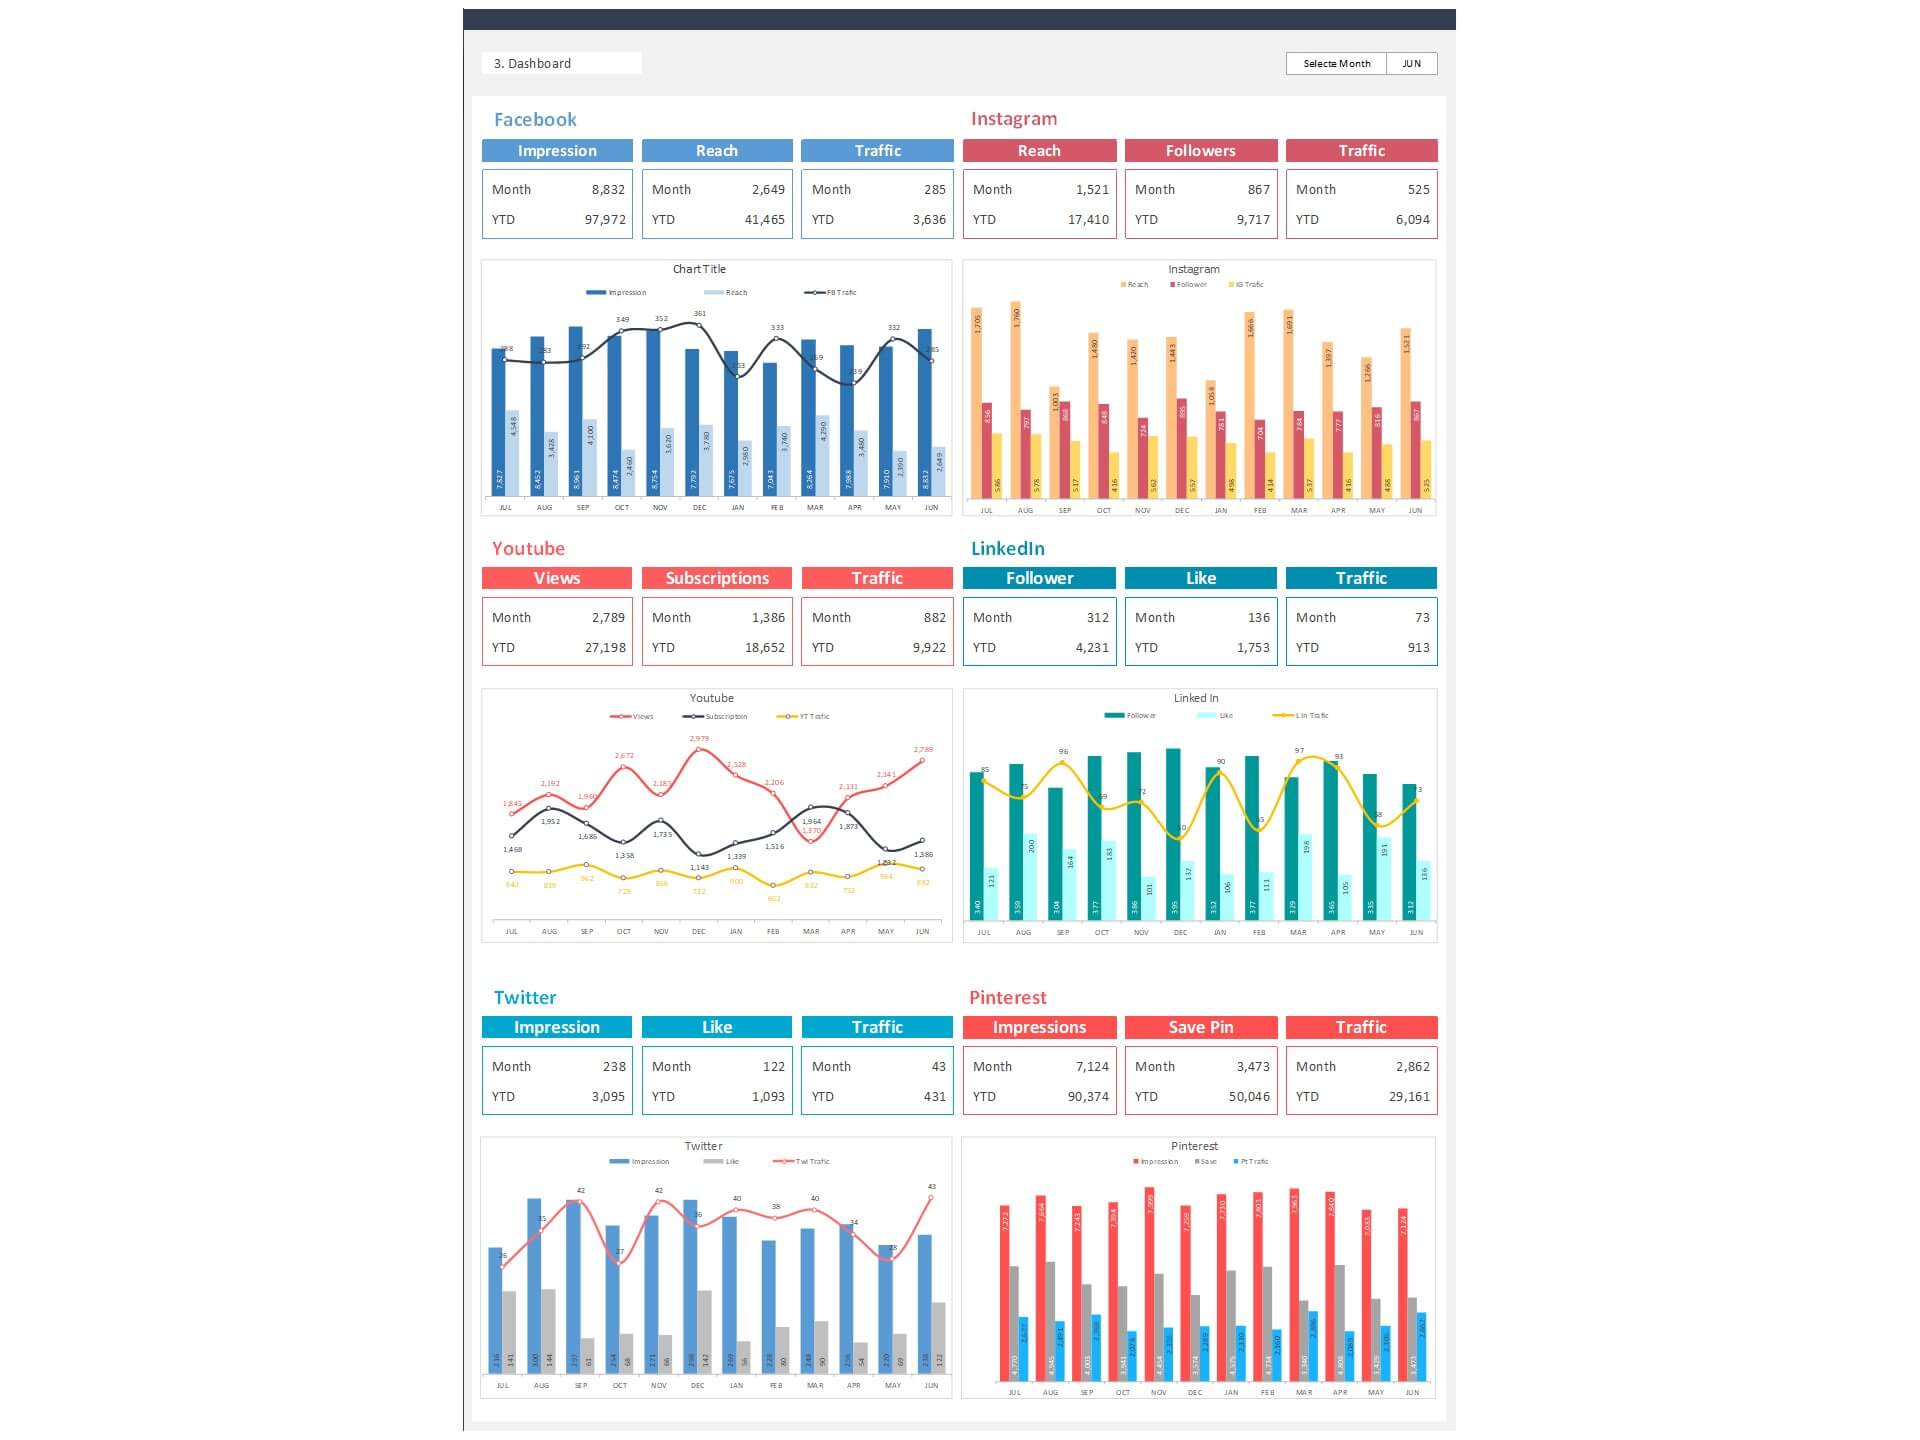
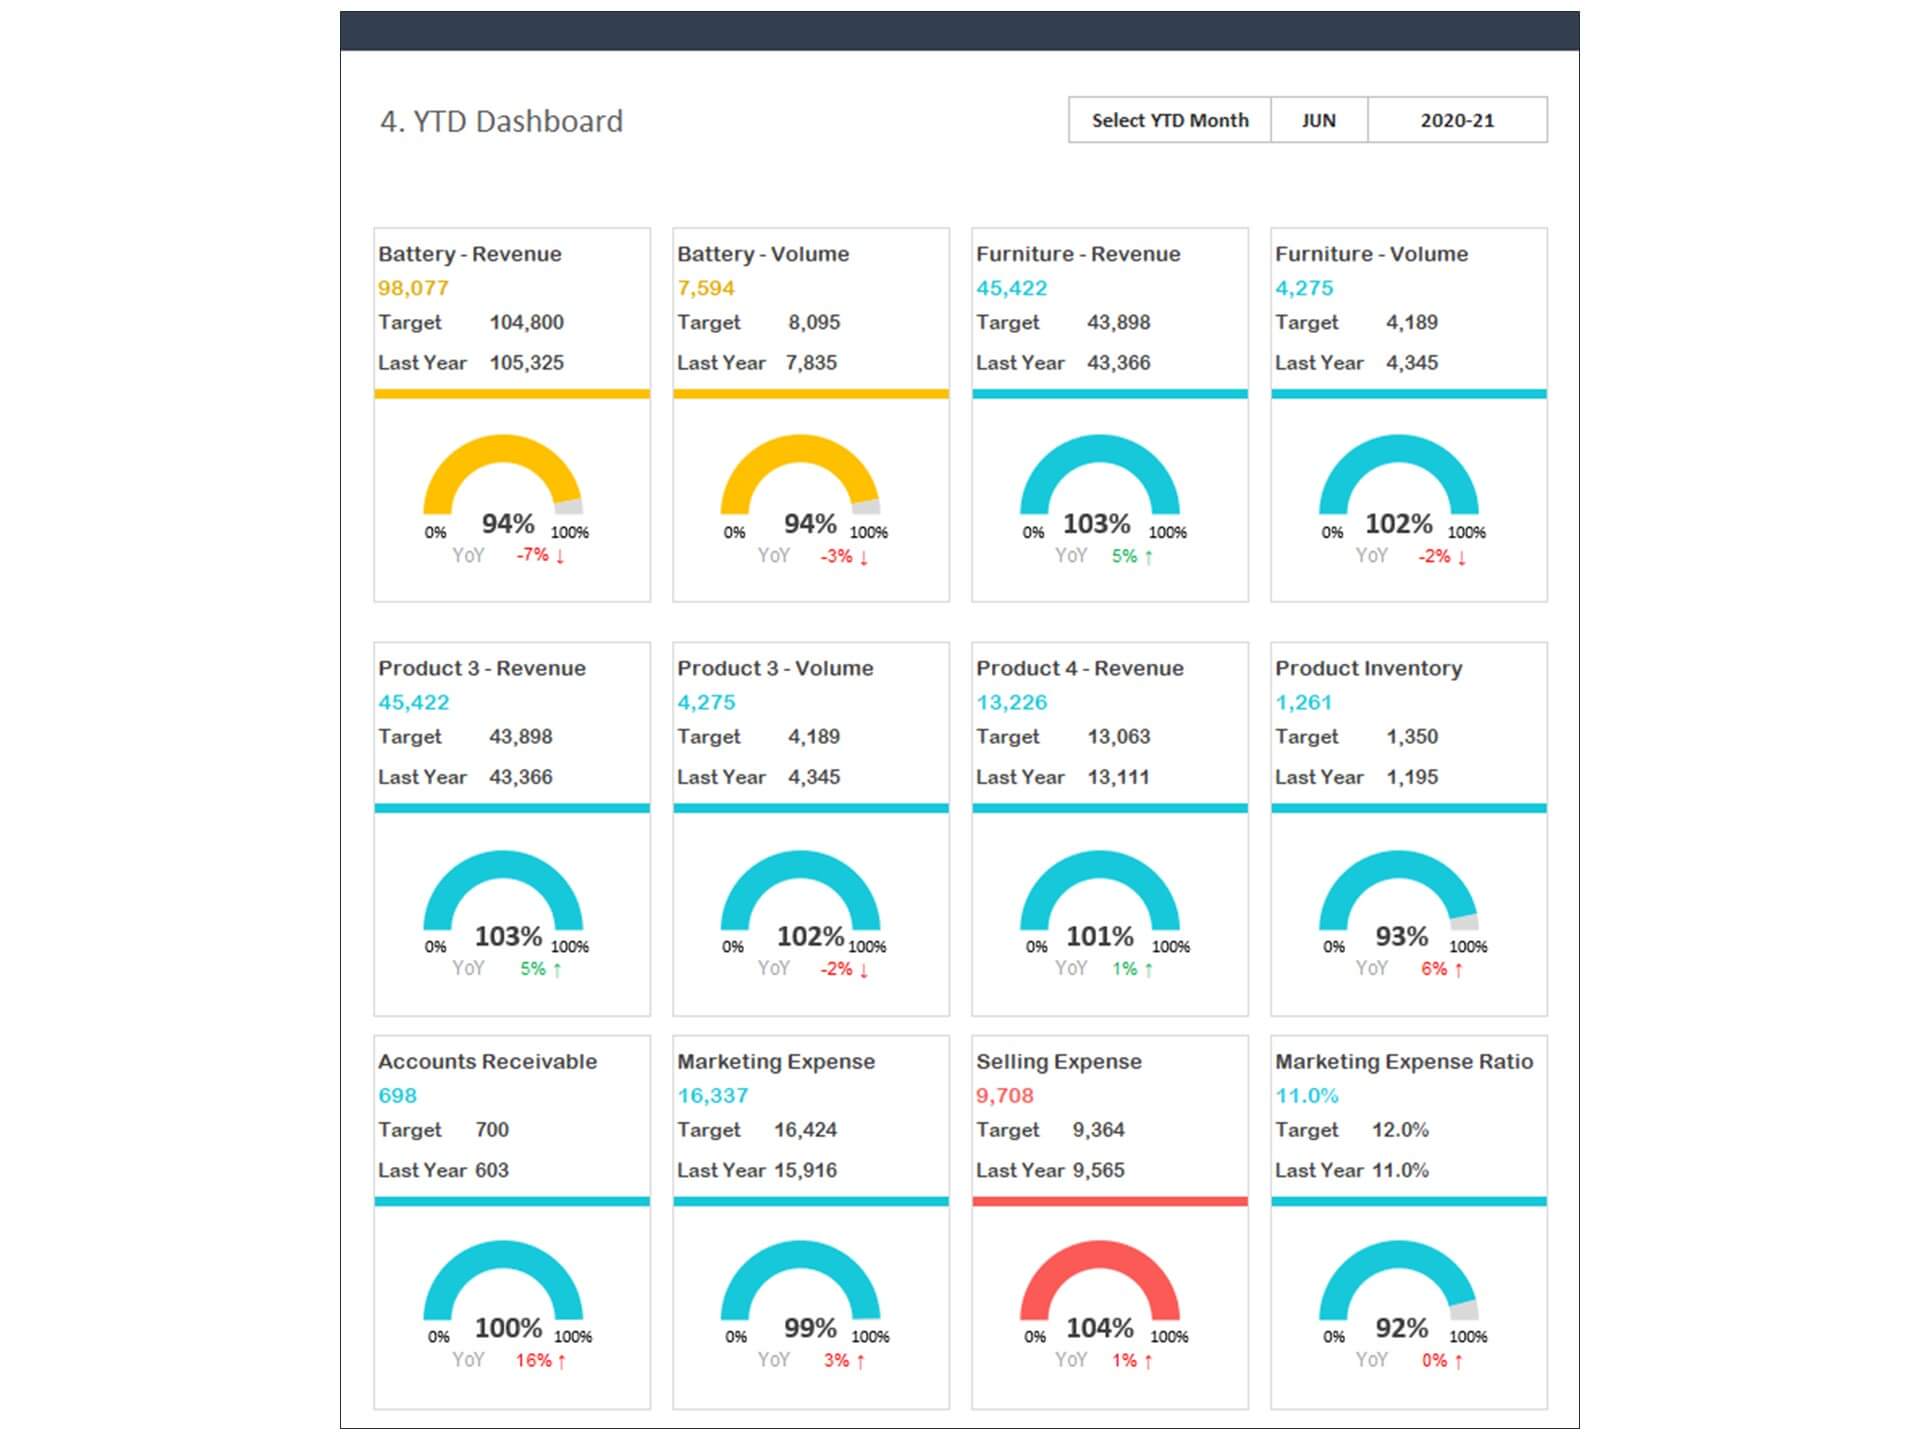
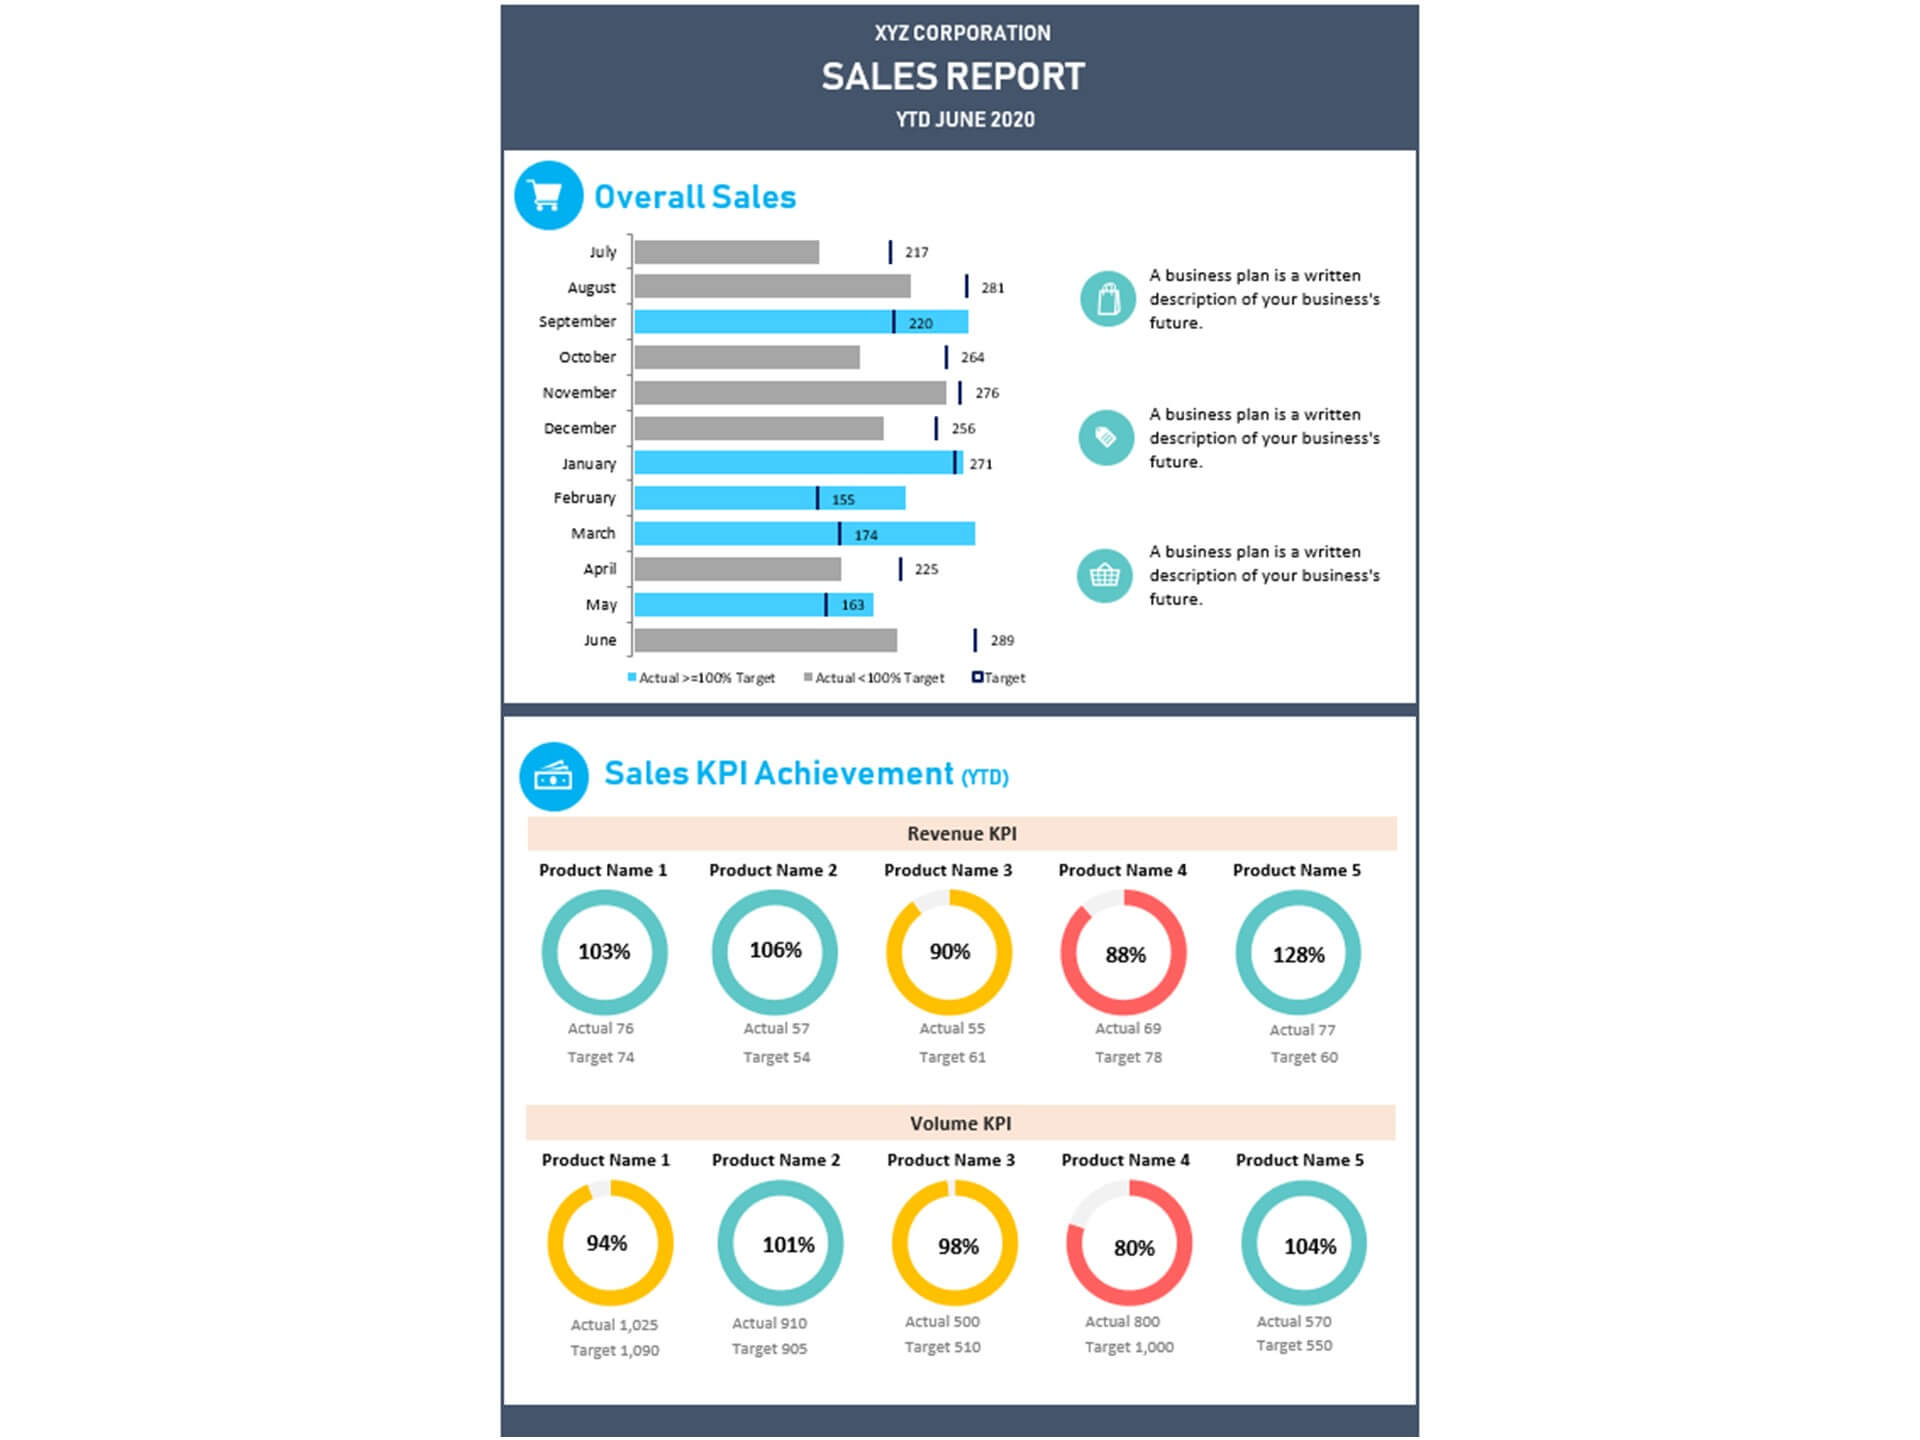
- Visualize overall sales performance
- Fully editable, easy to use, template with sample data
- Eye-catching design and customizable
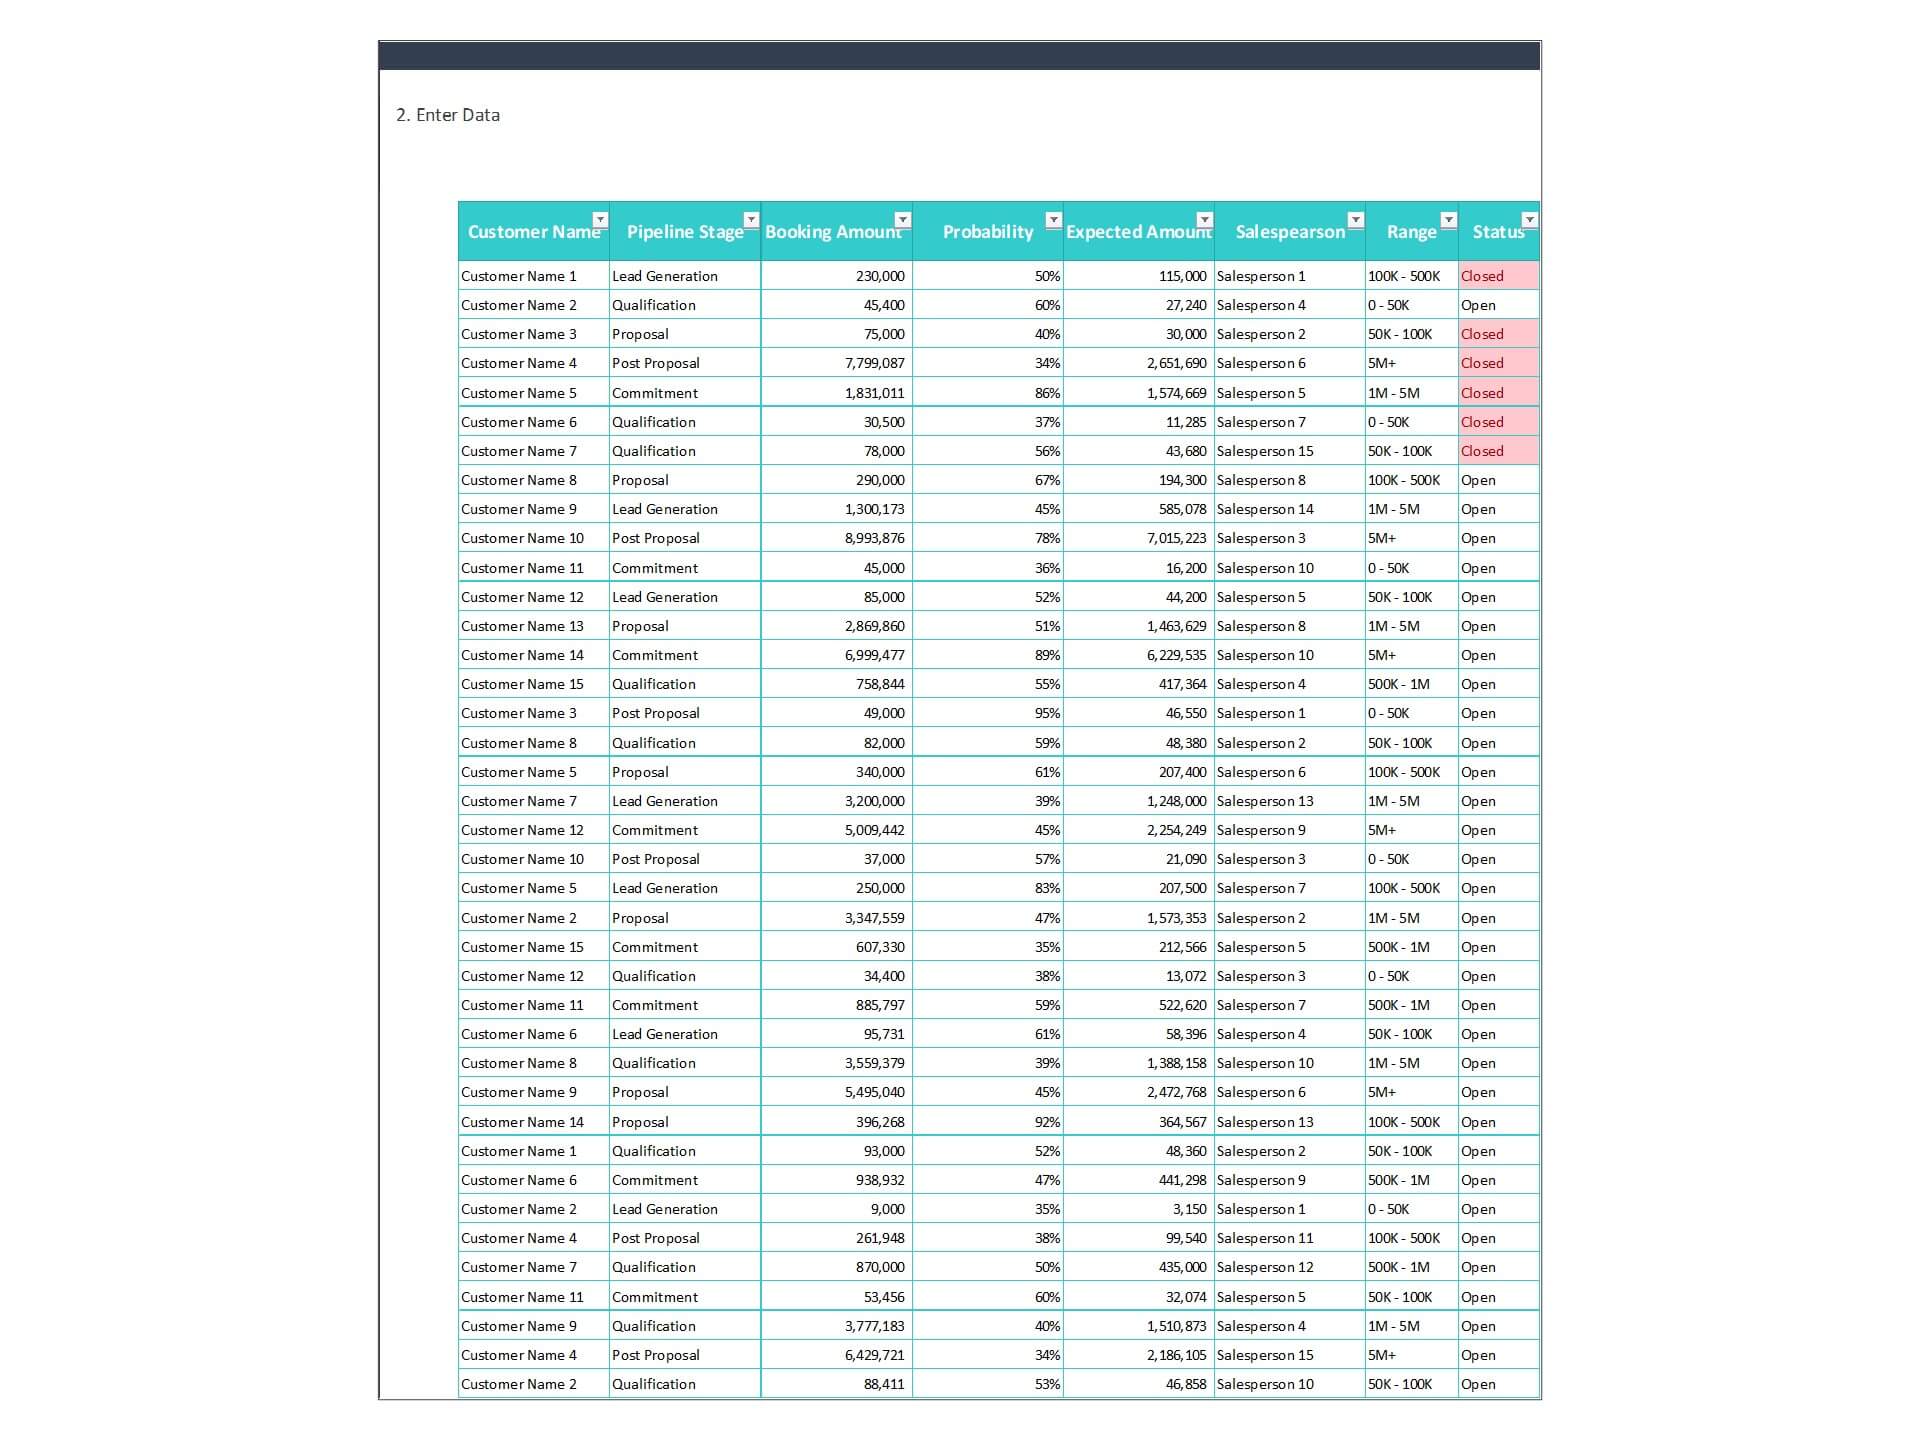
- Change the sample data with your data
- Spreadsheets ready for printing without Biz Infograph logo
- Consolidate key financial performance indicators in one dashboard
- No monthly fees
- Immediate download
- No VBA, no Macro
- No installation necessary
- Professionally designed
What is included in this dashboard template?
- Just plug your data, the dashboard will be ready instantly and start using.
- A text file which contains a password to view and edit the formula
- A guide to unlocking all the elements in the dashboard
Professional Support:
- Video tutorial guide on how to navigate and use Sales Pipeline Dashboard Sales Dashboard Template
- Professional service to customize dashboard template in excel as per business need
- Help and support in post-purchase
- Payment secured by Stripe and PayPal (no PayPal account needed)
A brief guide to using the dashboard template:
- Open the dashboard template
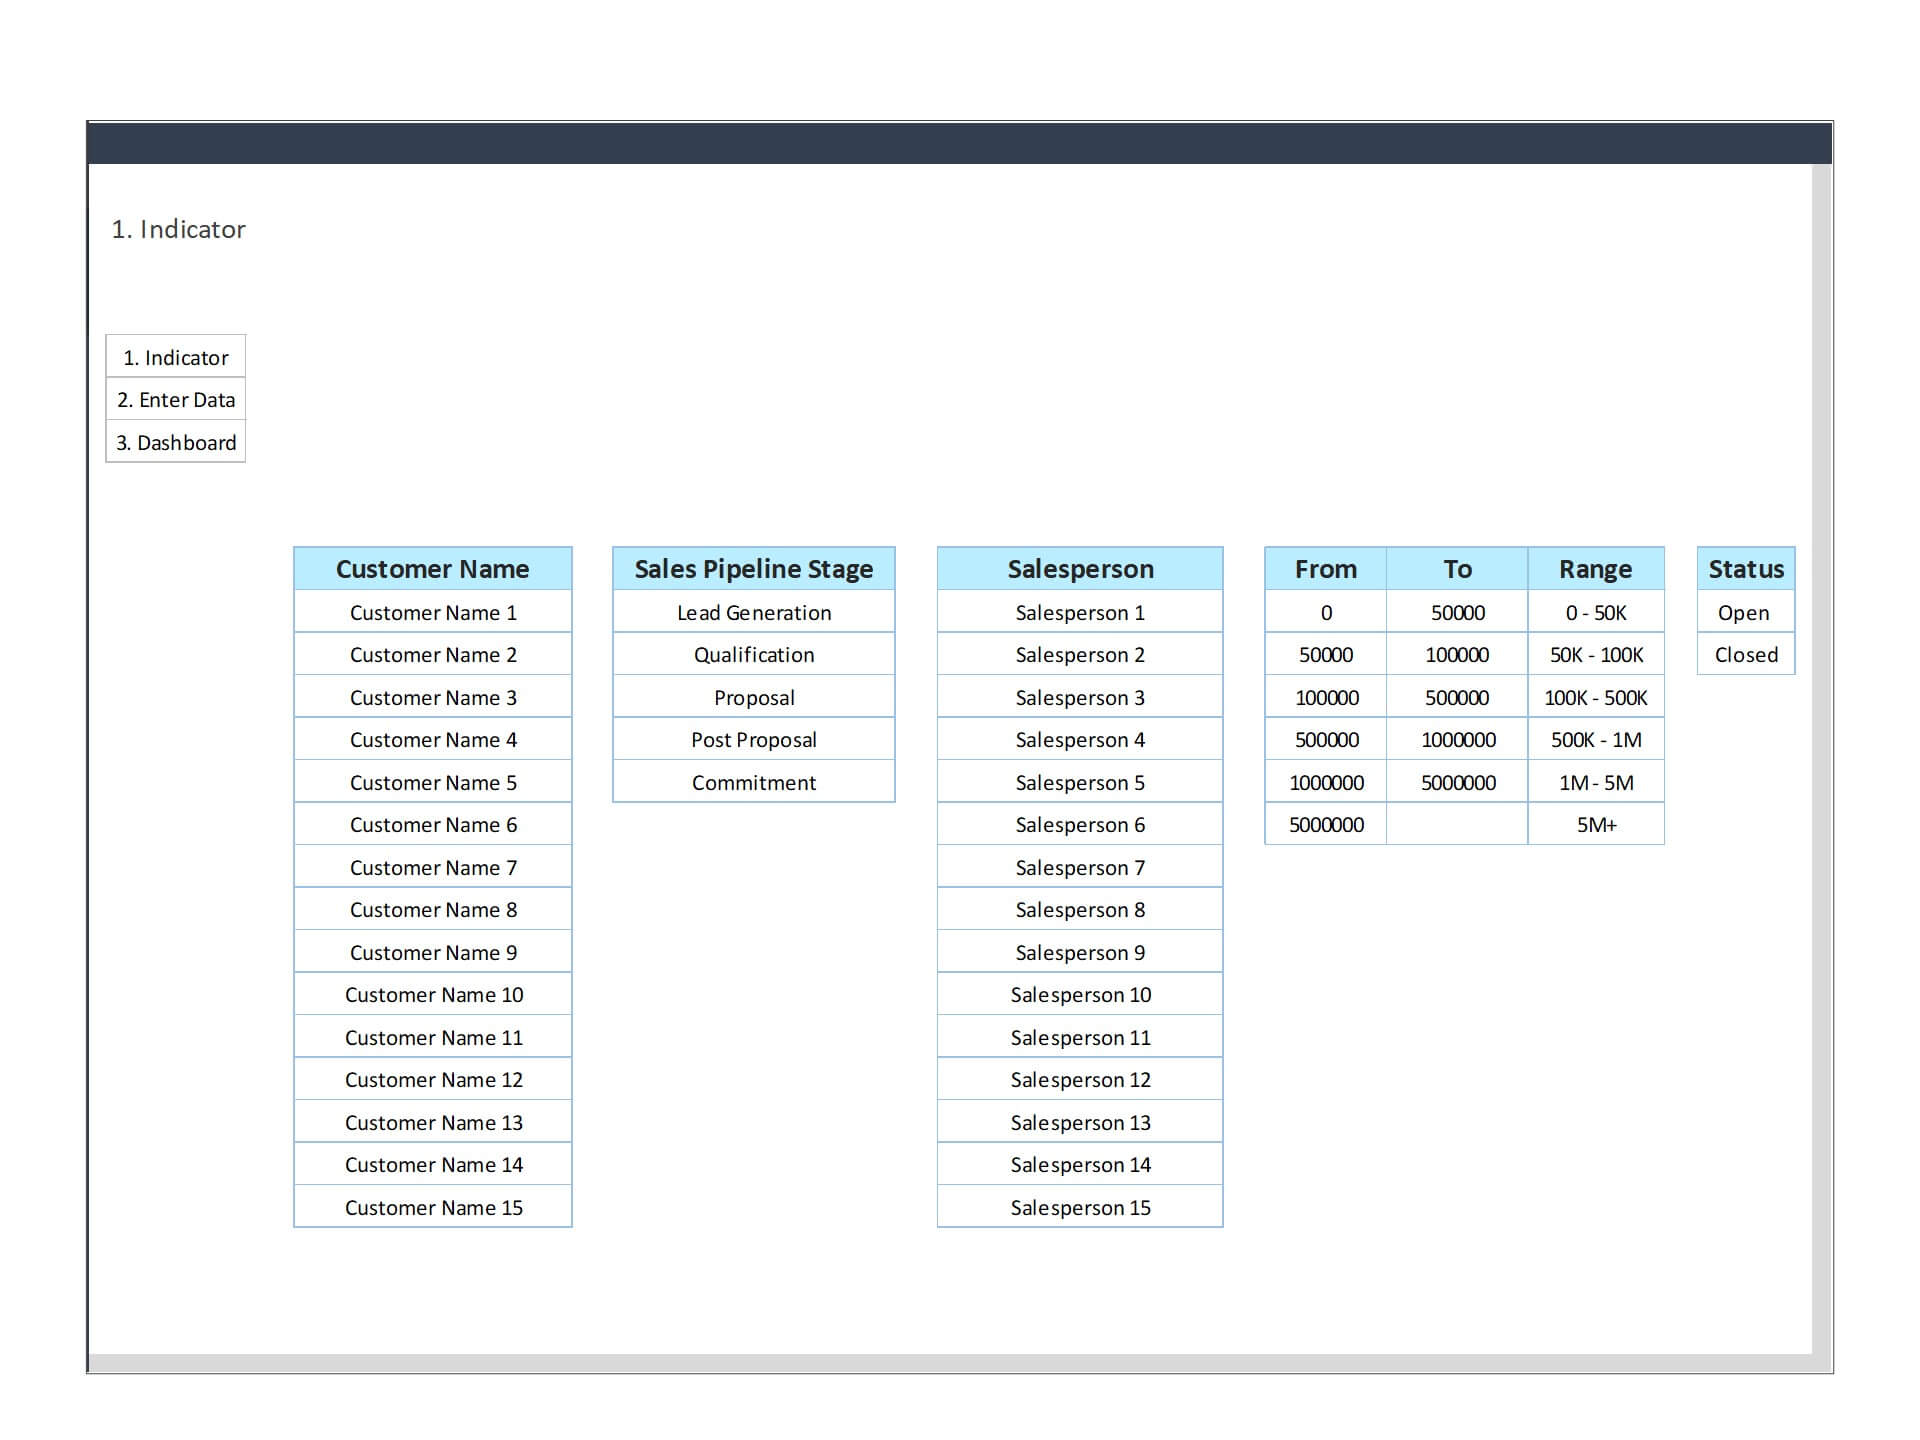
- Go to ‘Indicators’ menu – choose the start month of the fiscal year (i.e. Jan, Feb, Jul, etc.)
- Go to the ‘Enter Data’ menu – remove the sample data and give your actual data in the respective cells. Formula cells are locked, and you cannot edit it without a password.
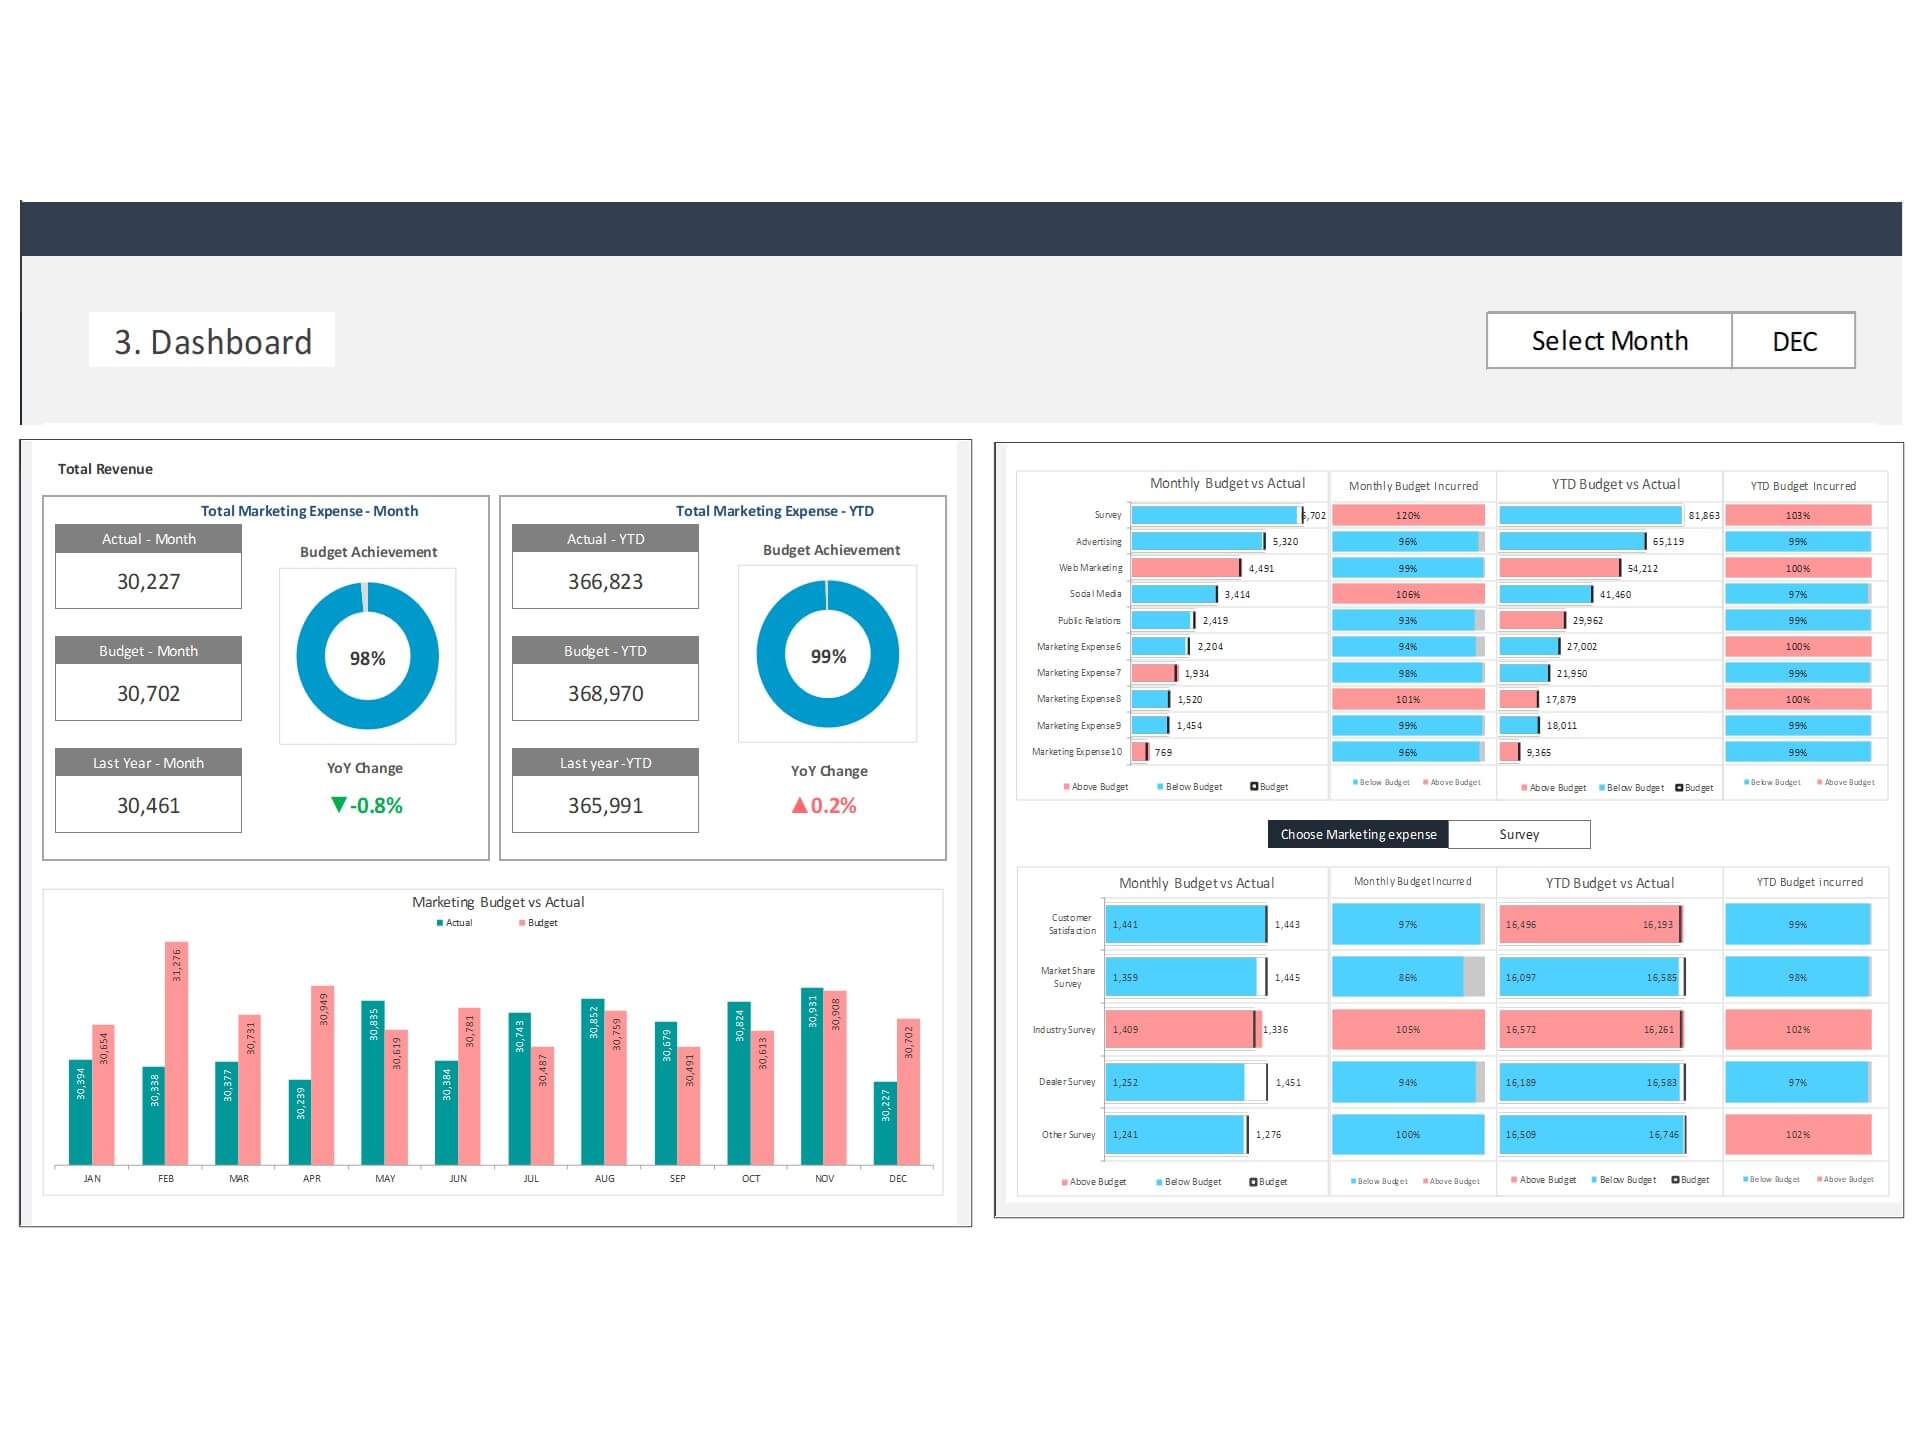
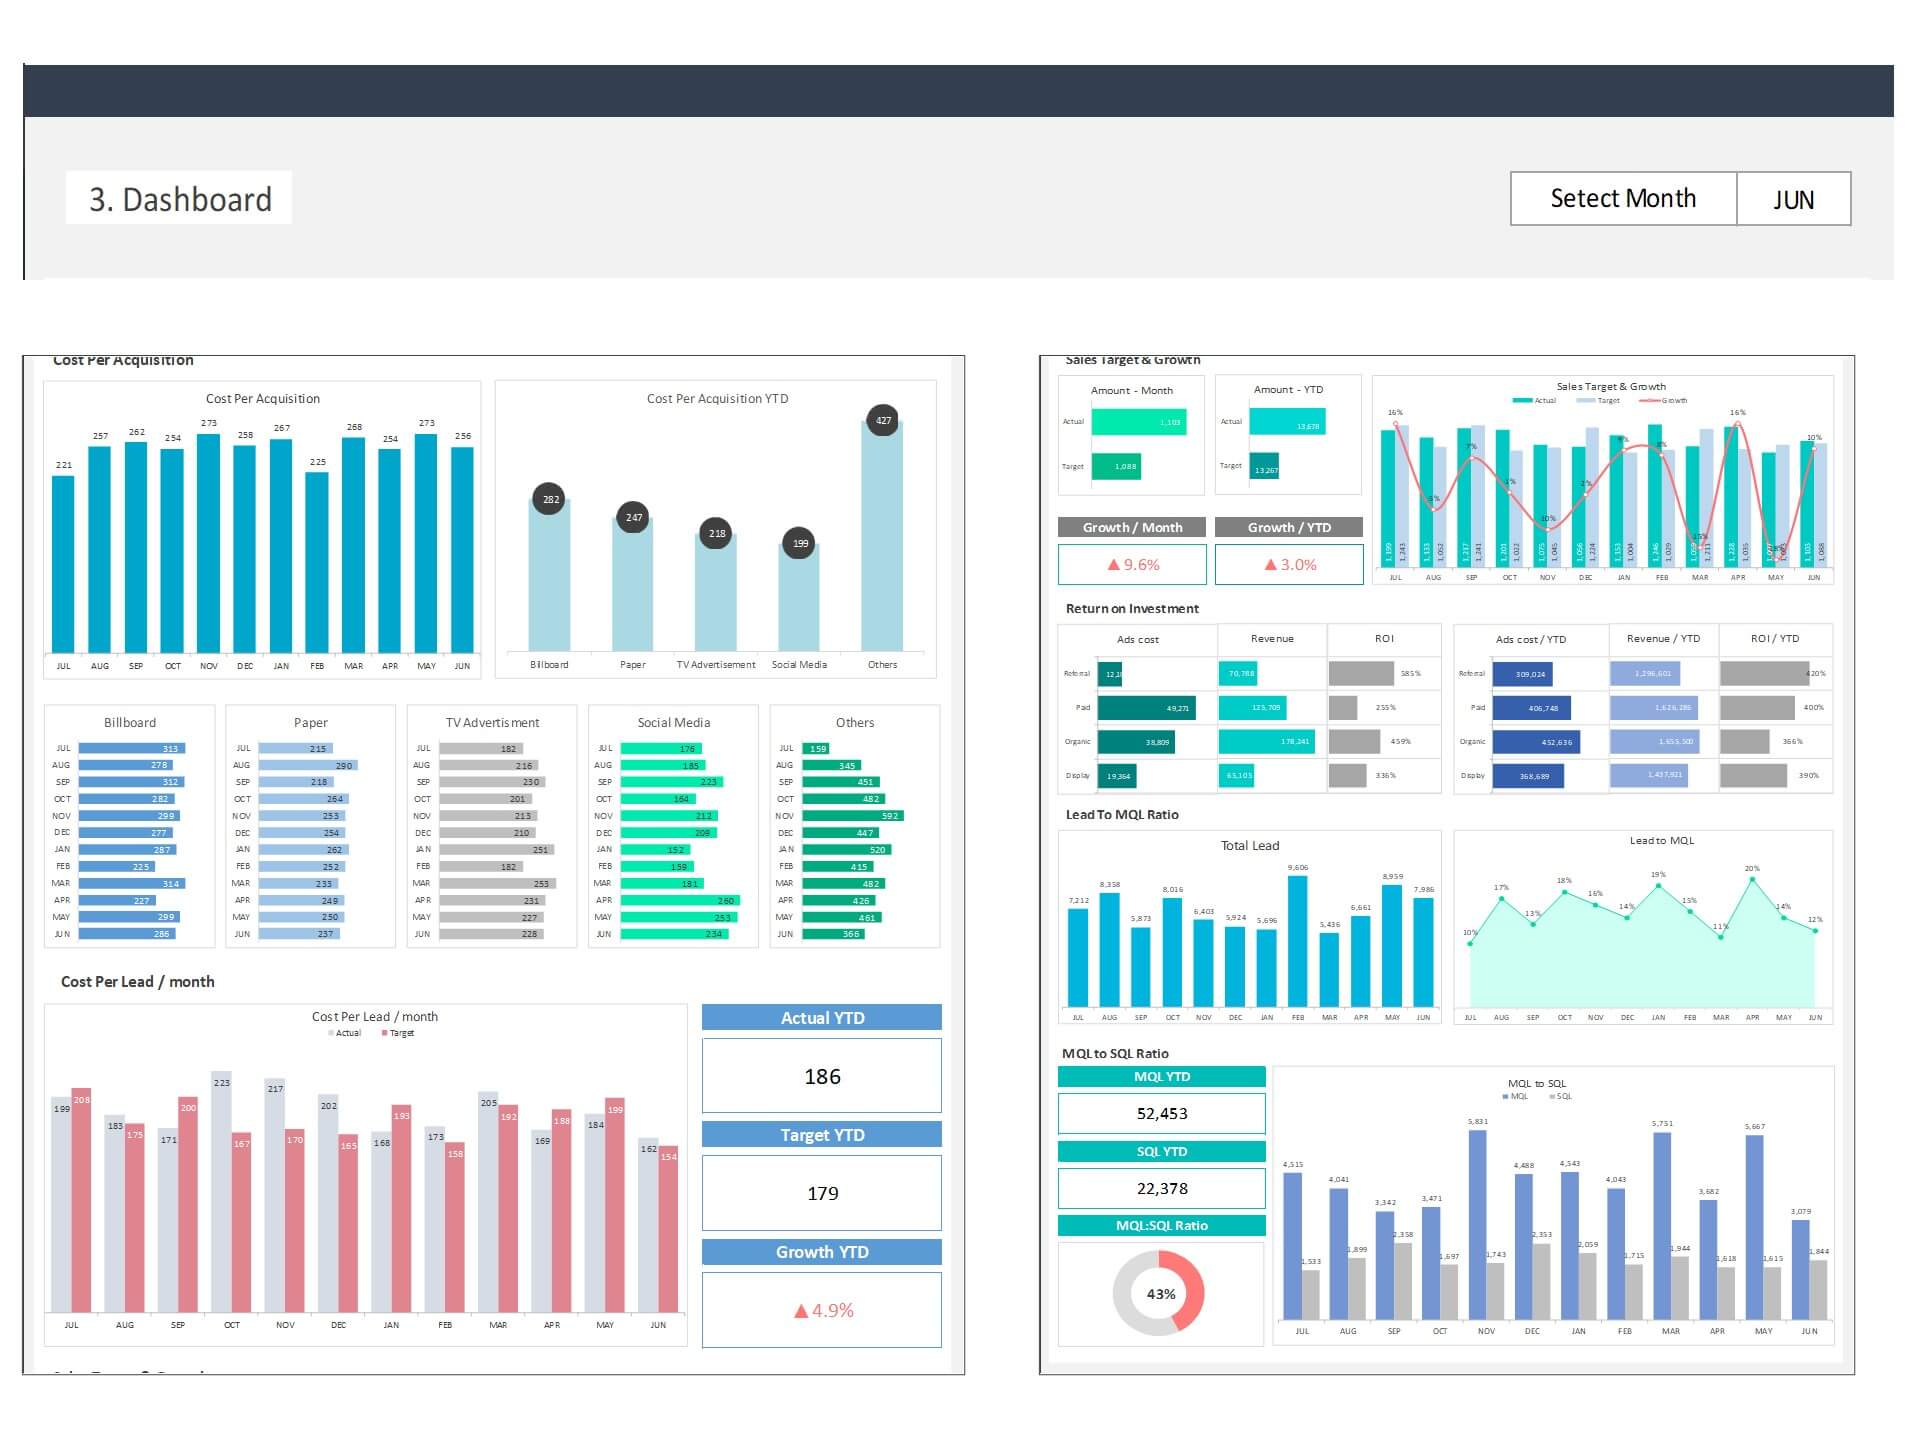
- Go to the ‘Dashboard’ menu – see the visualization of sales pipeline stages
- Each page is ready for printing – just press CTRL+P
This Excel dashboard template is password-protected to avoid mistakes, such as accidentally deleting formulas. When you completed the purchase, the password will be available.